These settings are aimed to customize the report view and organize the columns in the most convenient order.
To access the columns settings it is required to click 👁 icon on the panel.

The columns settings window consists of two parts: columns visibility and columns order.
¶ Columns Visibility
The section contains lists of columns associated with the selected report.
¶ Column Groups
There are 8 groups of columns in the Columns Visibility section:
- General;
- Total Events Data;
- Basic Financial Data;
- Key Performance Data;
- Advanced Data on Events;
- Invalid Traffic Details;
- Advanced Conversions Data;
- Custom Columns.
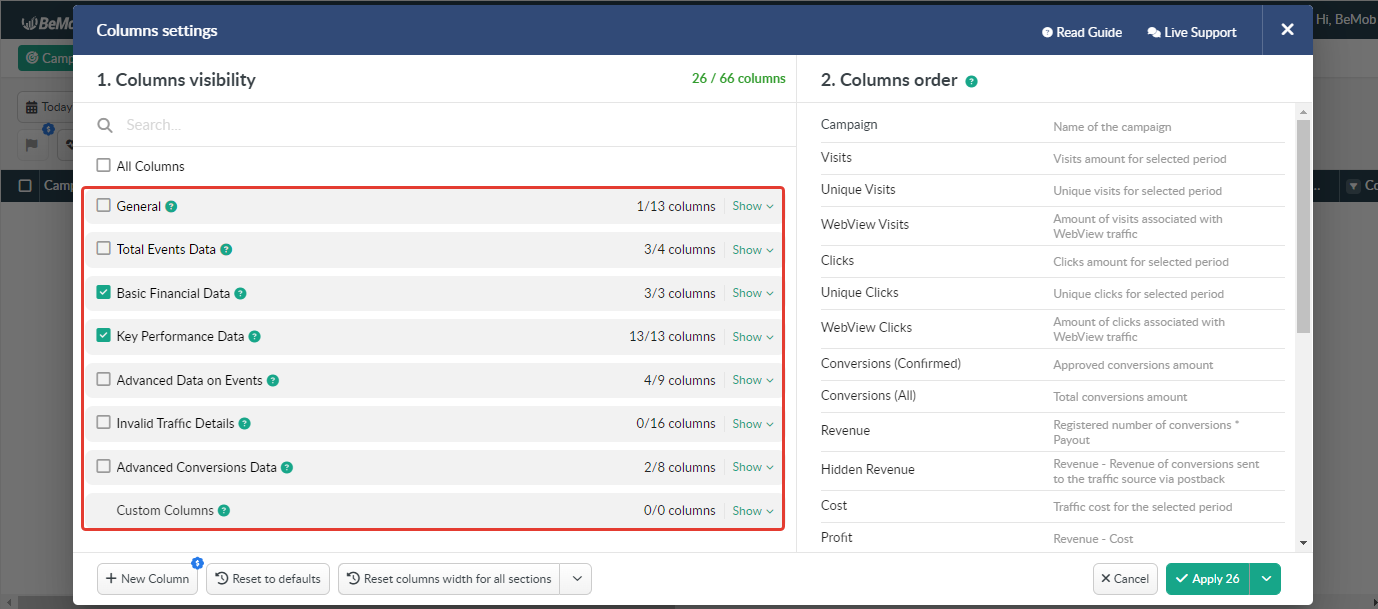
Columns grouping is not applicable to the following reports: Conversions, Postbacks, Errors, Live Visits / Live Clicks.
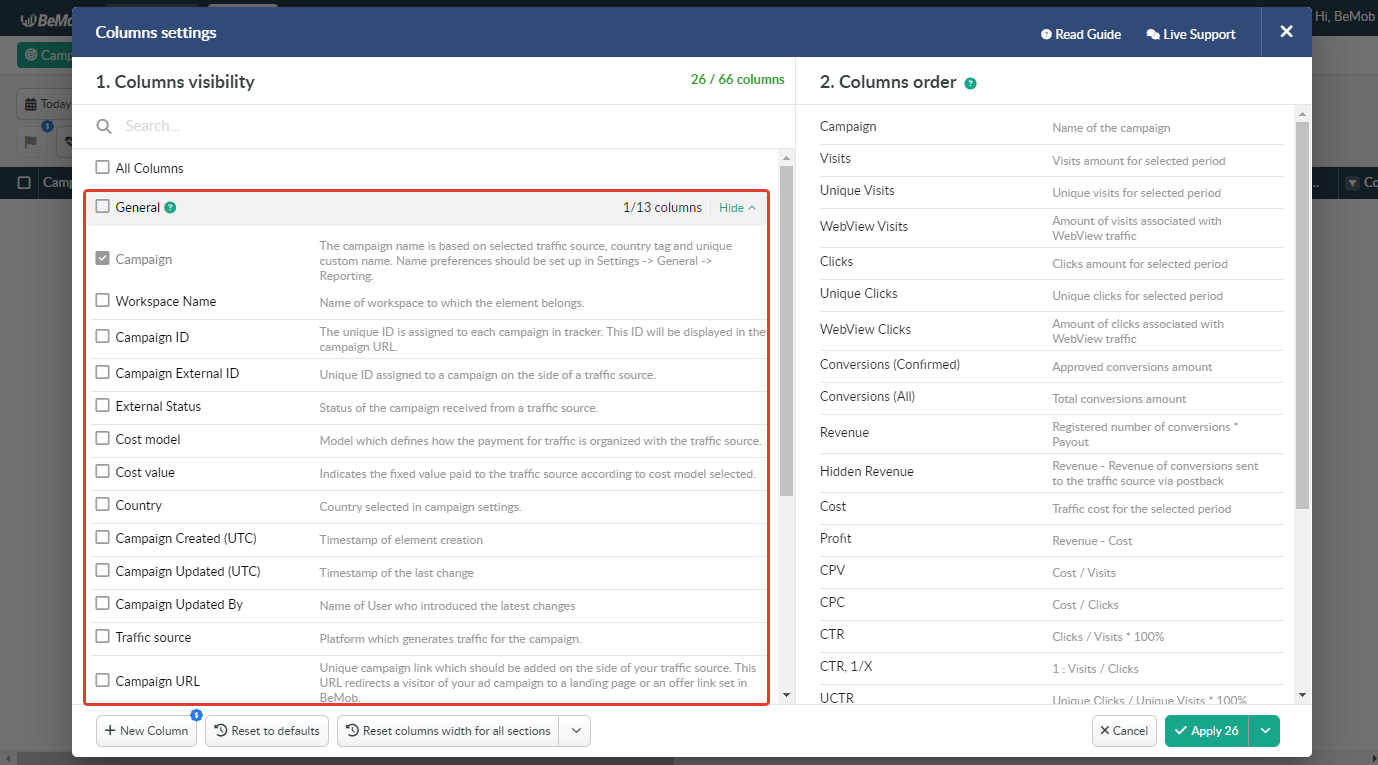
- General
It includes the columns which are used to display general data of an element or category of report.
Each report has its own list of general columns.
- Total Events Data
It contains the columns which display a sum of data on each event type for the selected period: Impressions, Visits, Clicks and Conversions (All).

- Basic Financial Data
It's composed of the columns which are used to display sum of cost, revenue and profit for the selected period: Cost, Revenue and Profit.

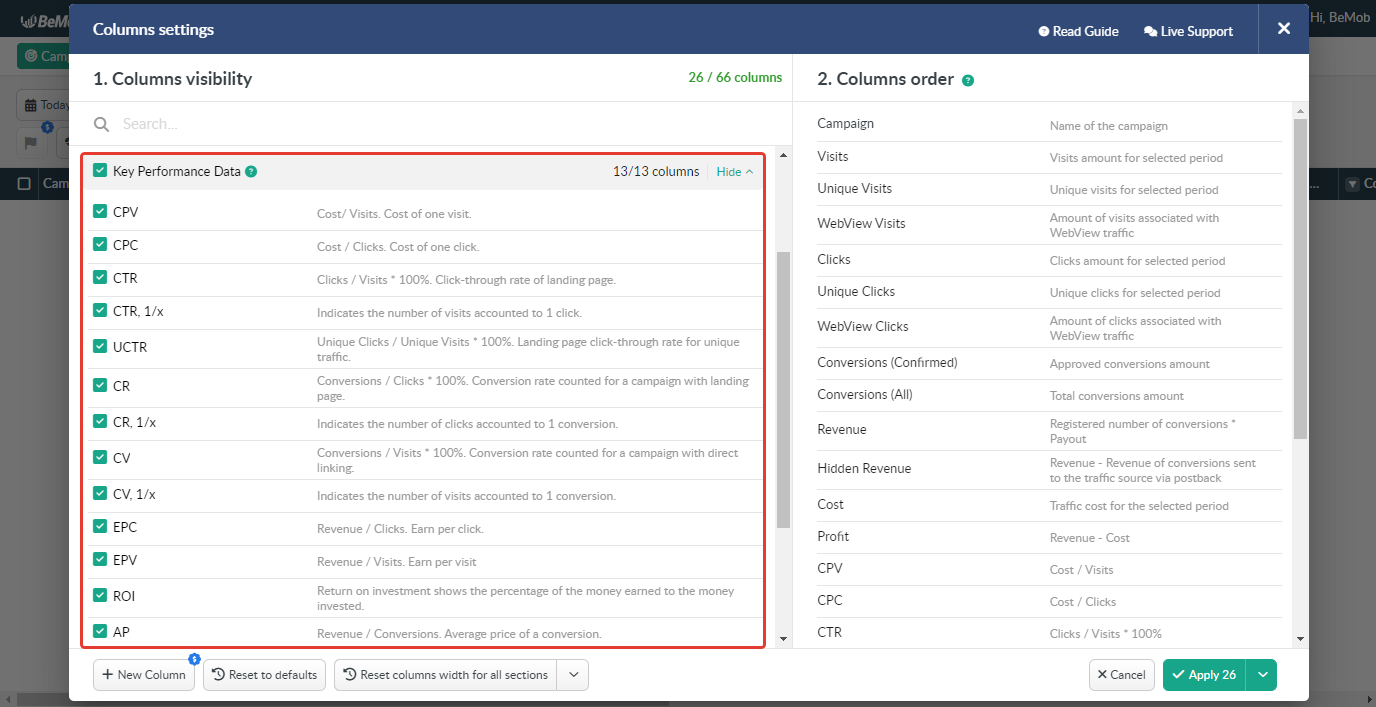
- Key Performance Data
It includes metrics indicating the performance of a campaign, campaign element or category for the selected period: e.g. CTR, CPV, ROI, AP etc.
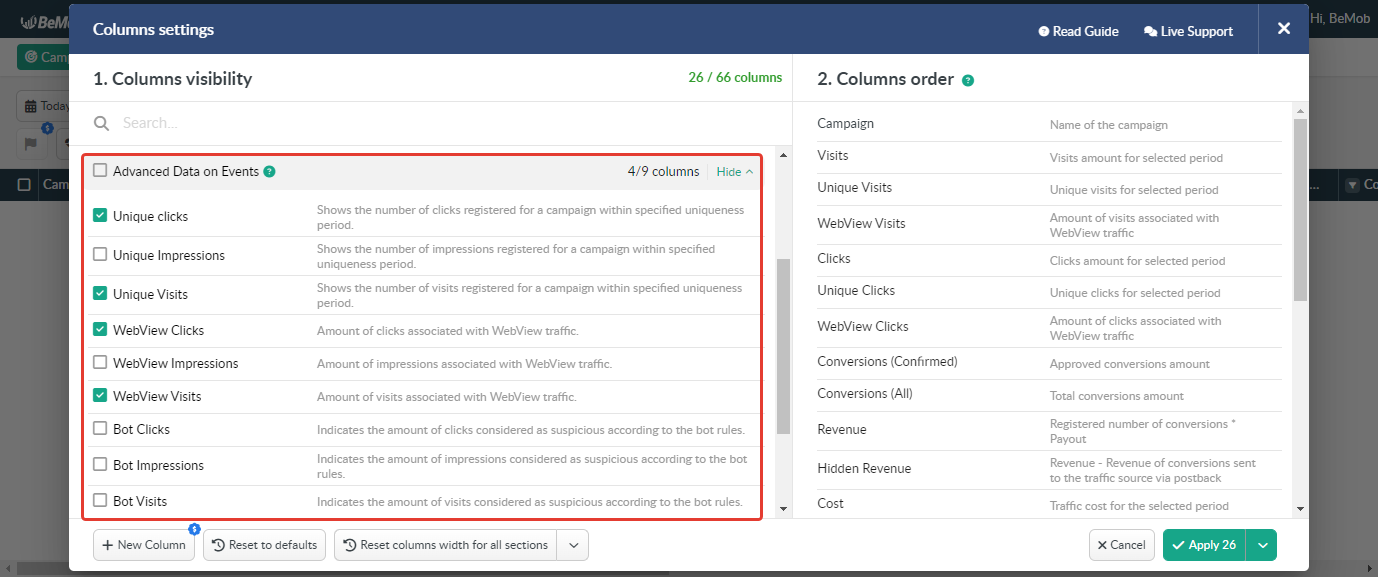
- Advanced Data on Events
It contains the columns which are used to display more detailed data on each event type for the selected period: e.g. Unique Impressions, WebView Visits, Bot Clicks etc.
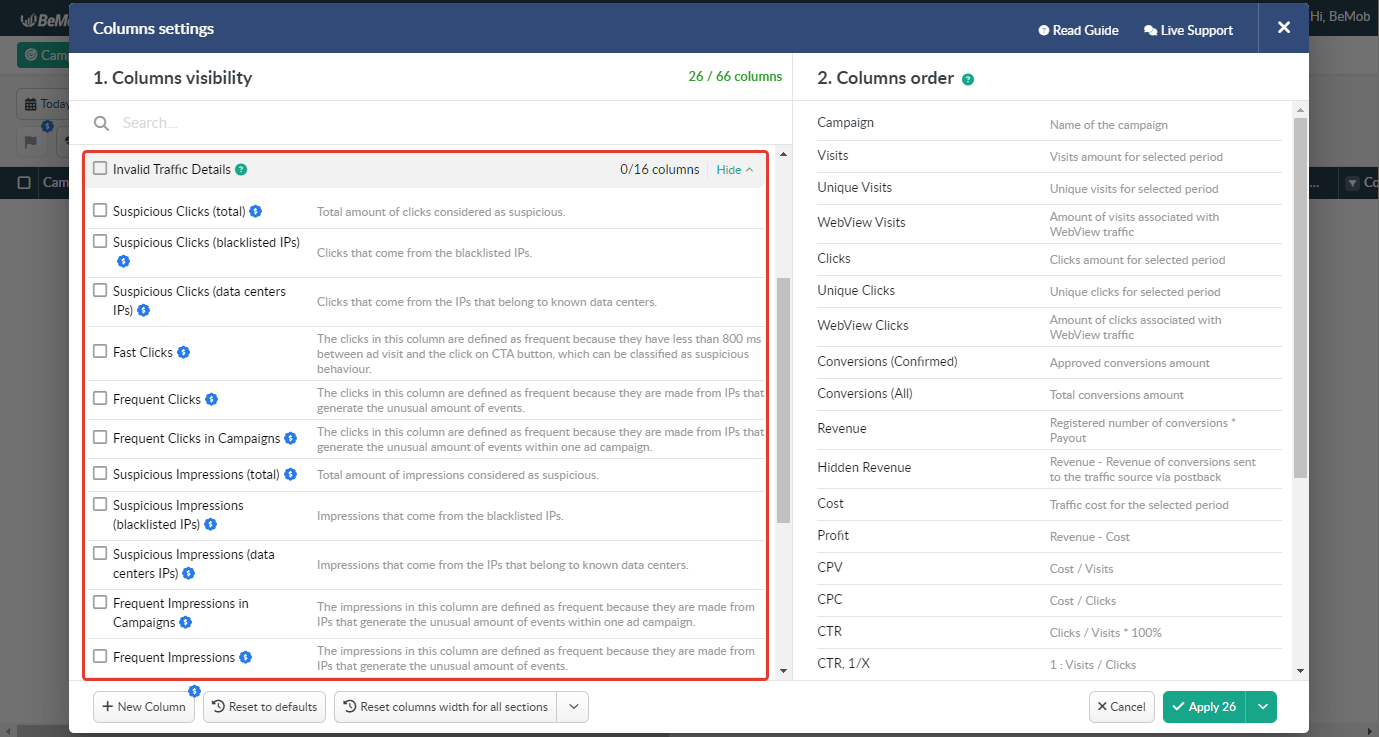
- Invalid Traffic Details
It's composed of the columns which are used to display data on invalid and suspicious traffic for the selected period: e.g. Suspicious Impressions (blacklisted IPs), Frequent Visits, Fast Clicks etc.
The columns which belong to this group can be added to the selected report only if IVT mertics option is included in your pricing plan or purchased as addon.
👉 More info about IVT Metrics can be found in this guide.
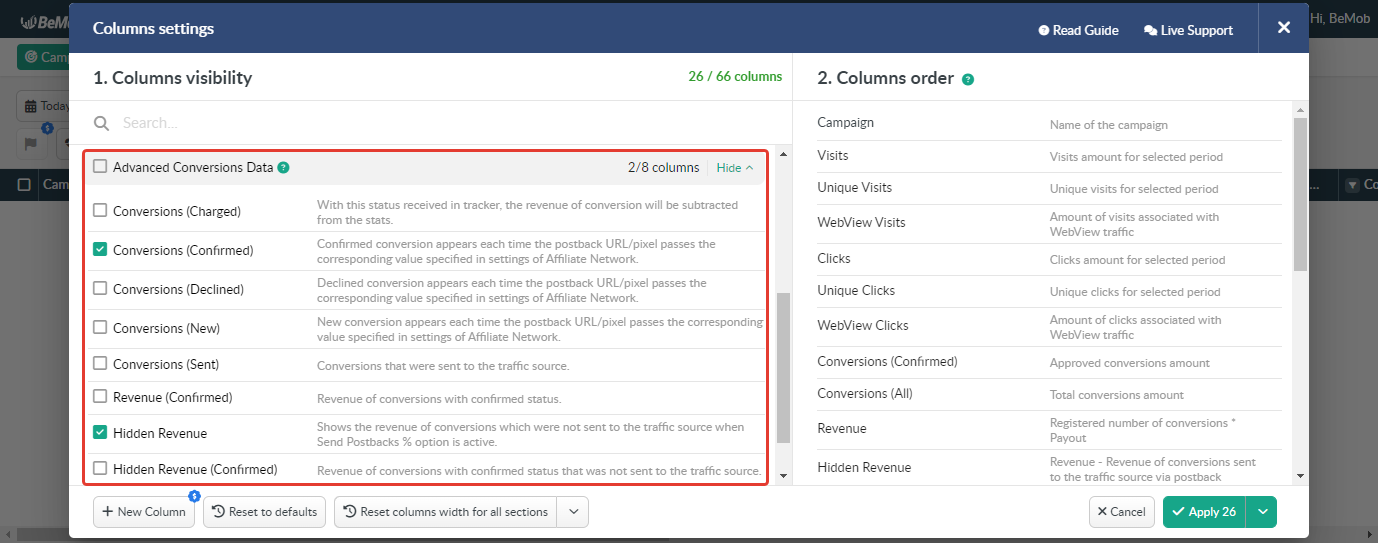
- Advanced Conversions Data
It includes the columns which display more detailed data on the status and revenue of conversions for the selected period: e.g. Conversions (Confirmed), Conversions (Sent), Hidden Revenue etc.
- Custom Columns
It contains the columns related to custom conversions and the custom columns created by your own.
The columns assocaited with custom conversions will be automatically added to this group if Custom Conversions option is included in your pricing plan or purchased as addon.
👉 The detailed guide on the сustom сonversions settings is available here.
It will be possible to create custom columns if Custom Columns option is included in your pricing plan or purchased as addon.
Your custom columns will be automatically added to this group.
👉 Learn more about custom columns in our dedicated guide.

Actions which can be applied to the groups of columns:
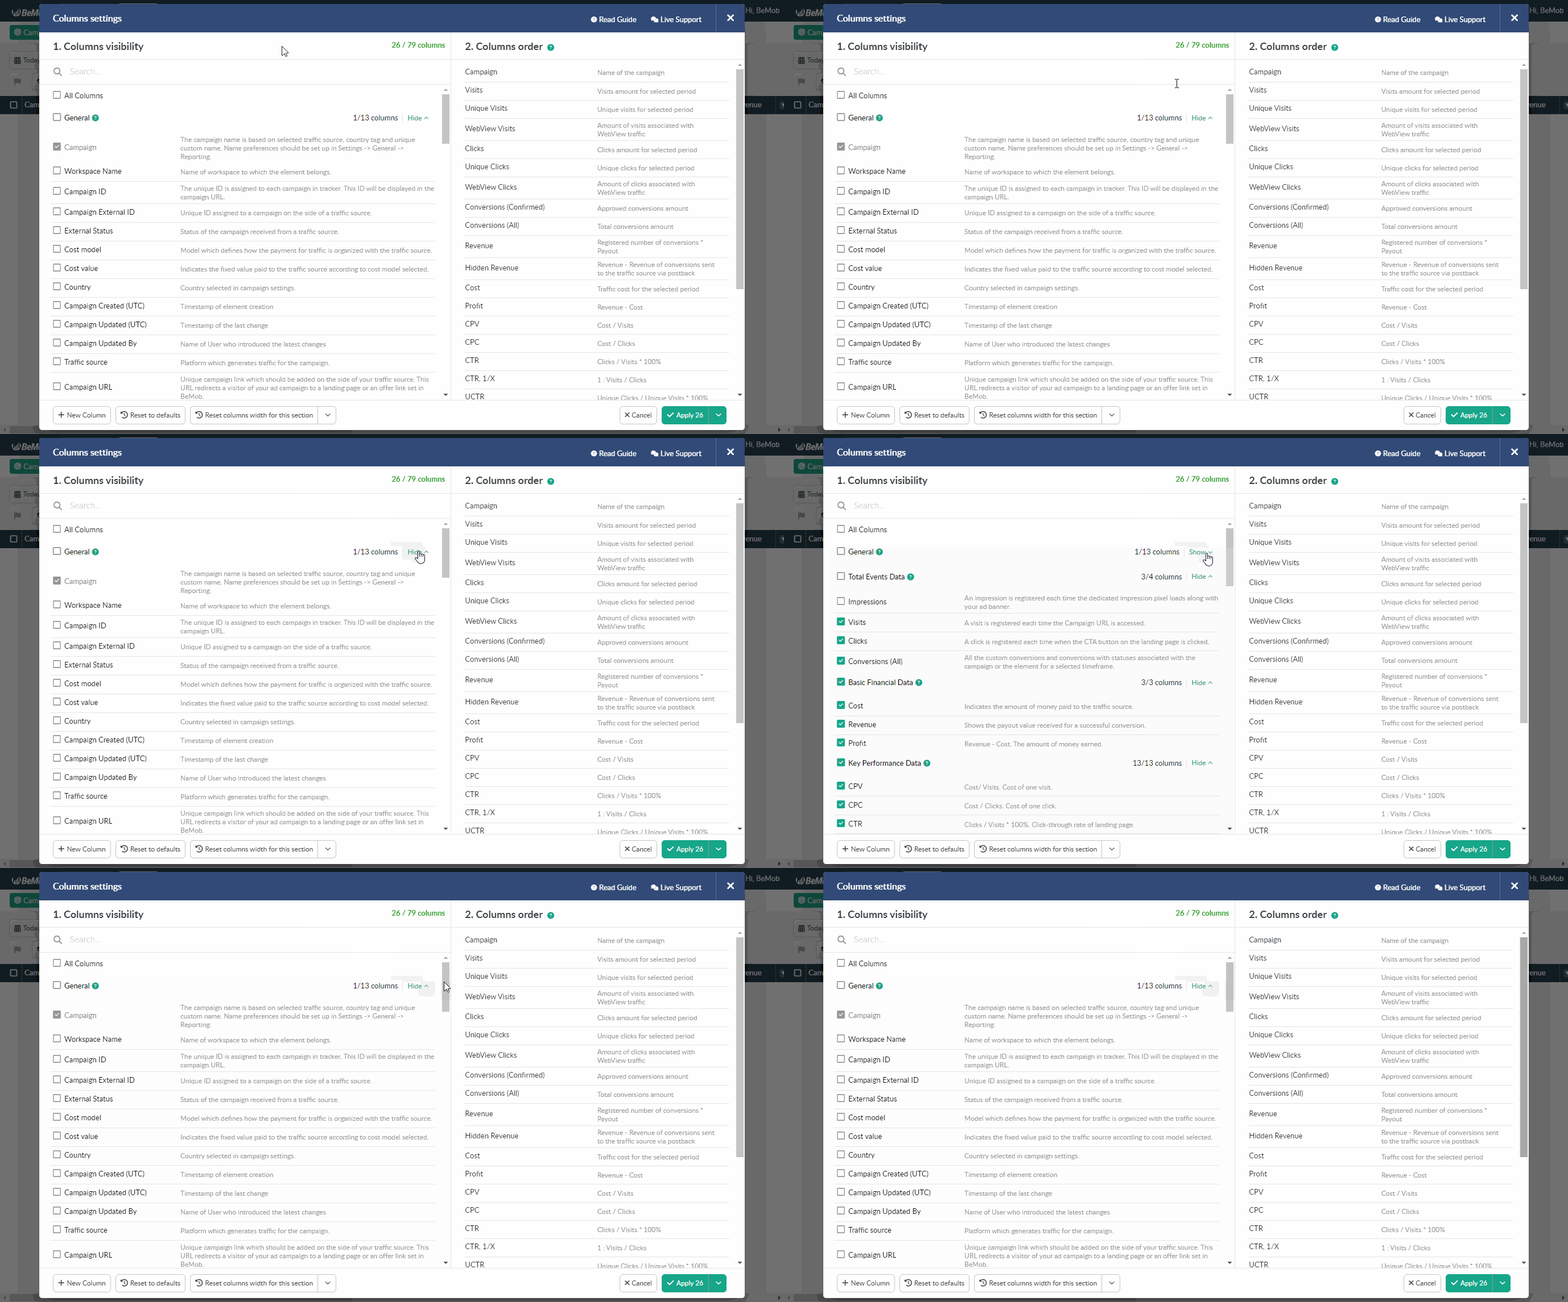
- show / hide
It's possible to expand / collapse the list of columns which belong to a certain group by clicking Show / Hide to the right of the required group name.
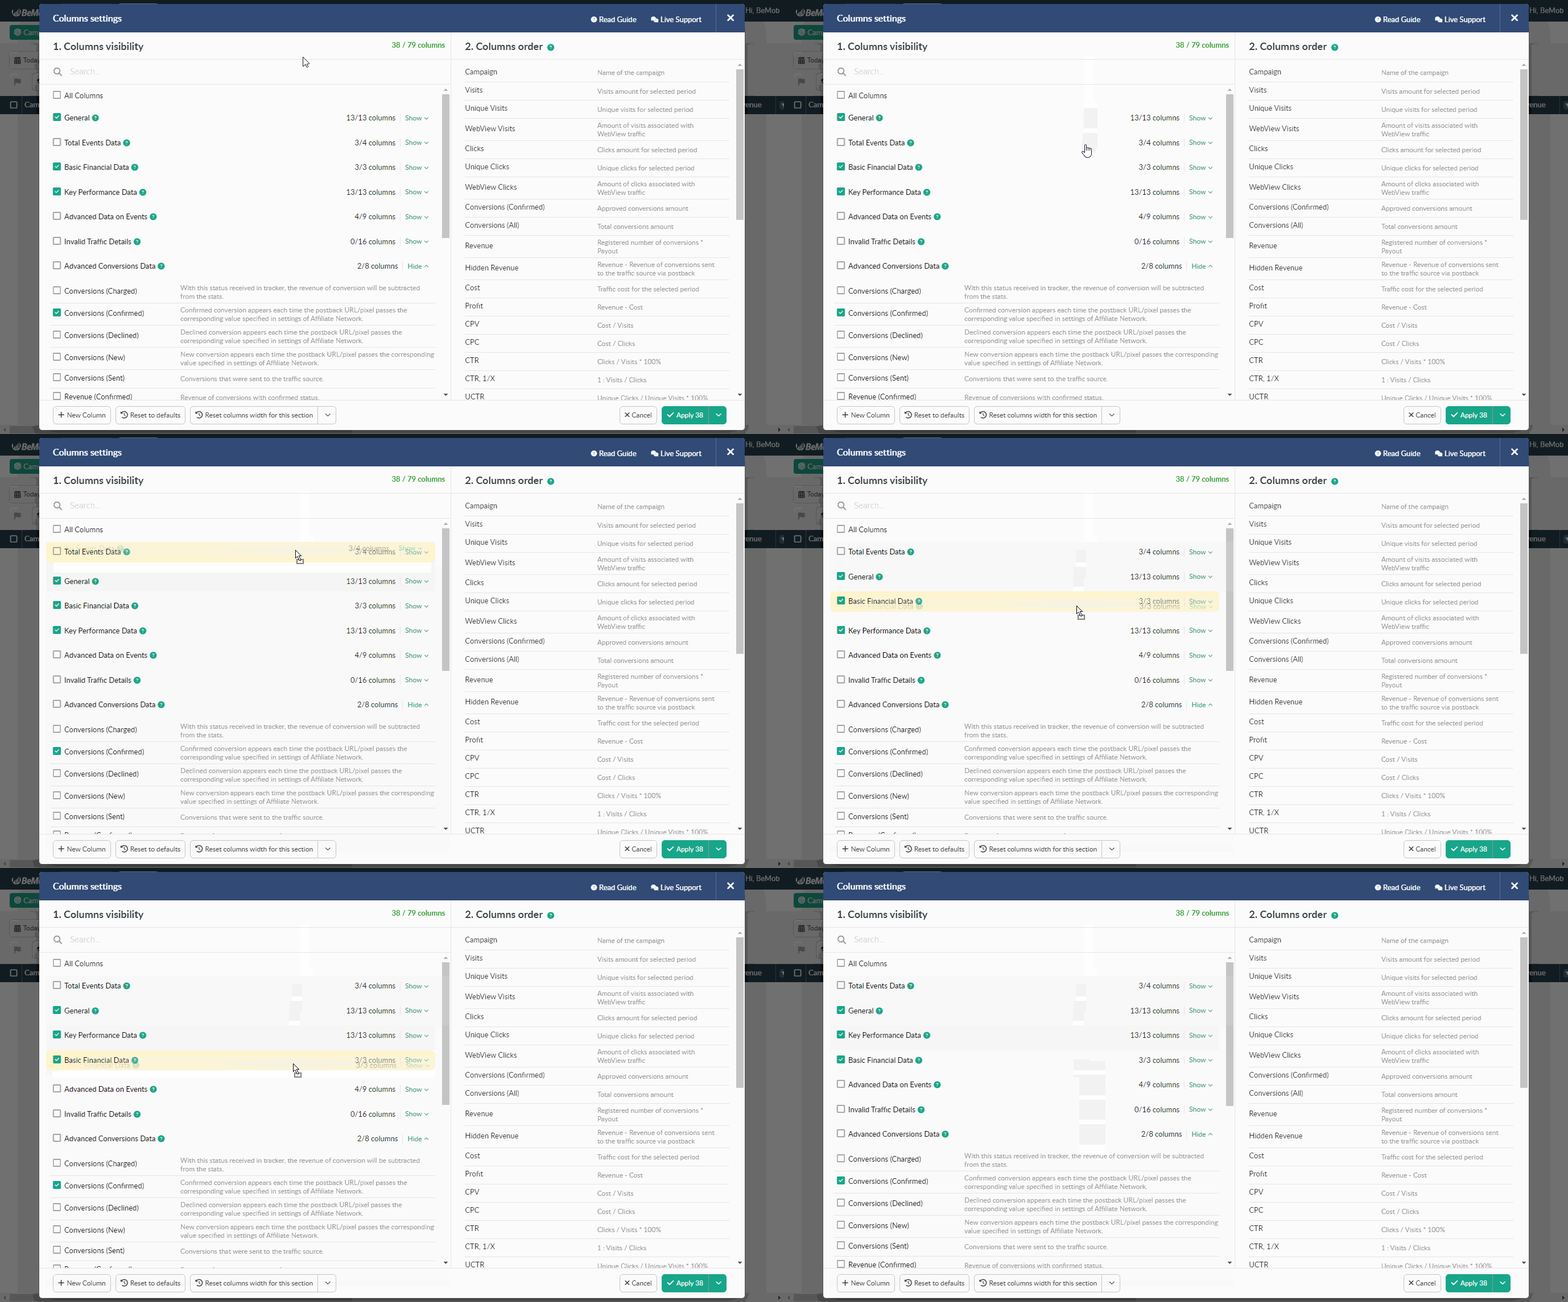
- changing groups order
You can change the order of column groups by dragging them up or down.
- bulk selection
To select all columns which belong to the required column group you should mark the checkbox next to the group name.
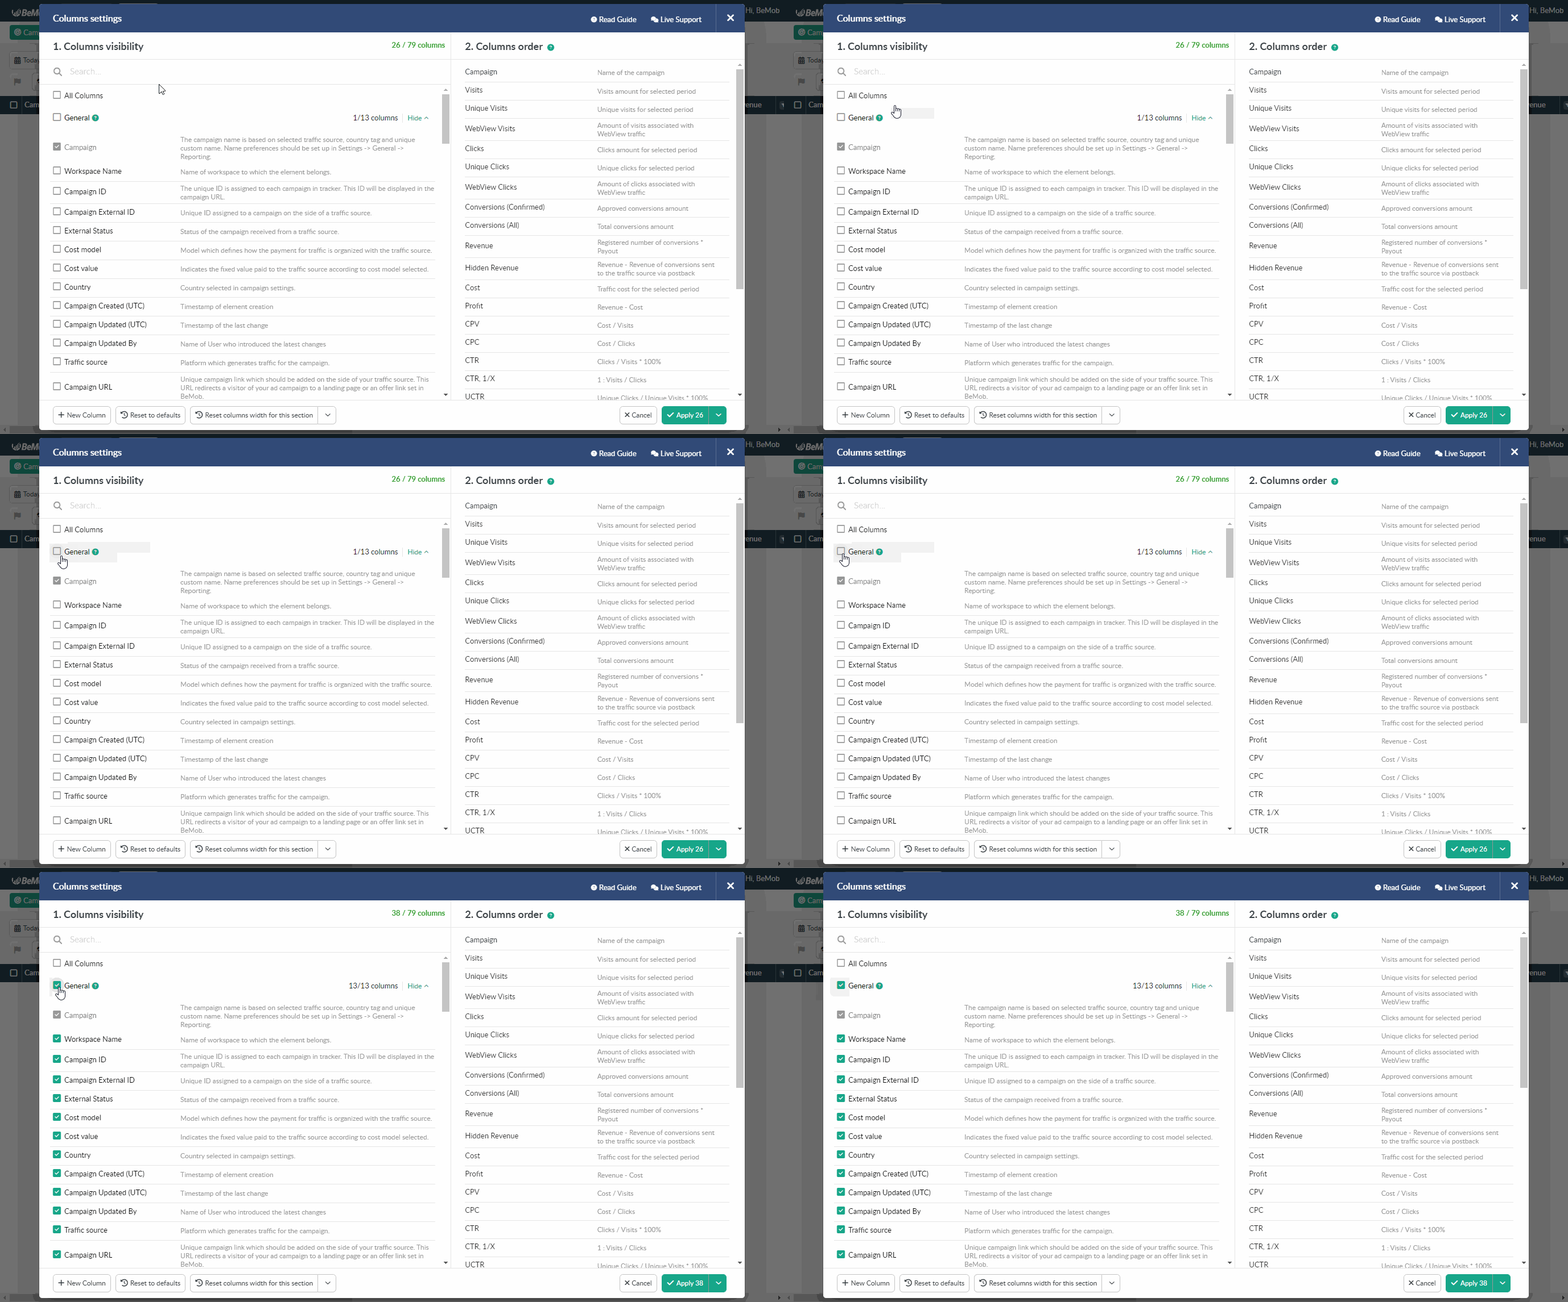
¶ Columns
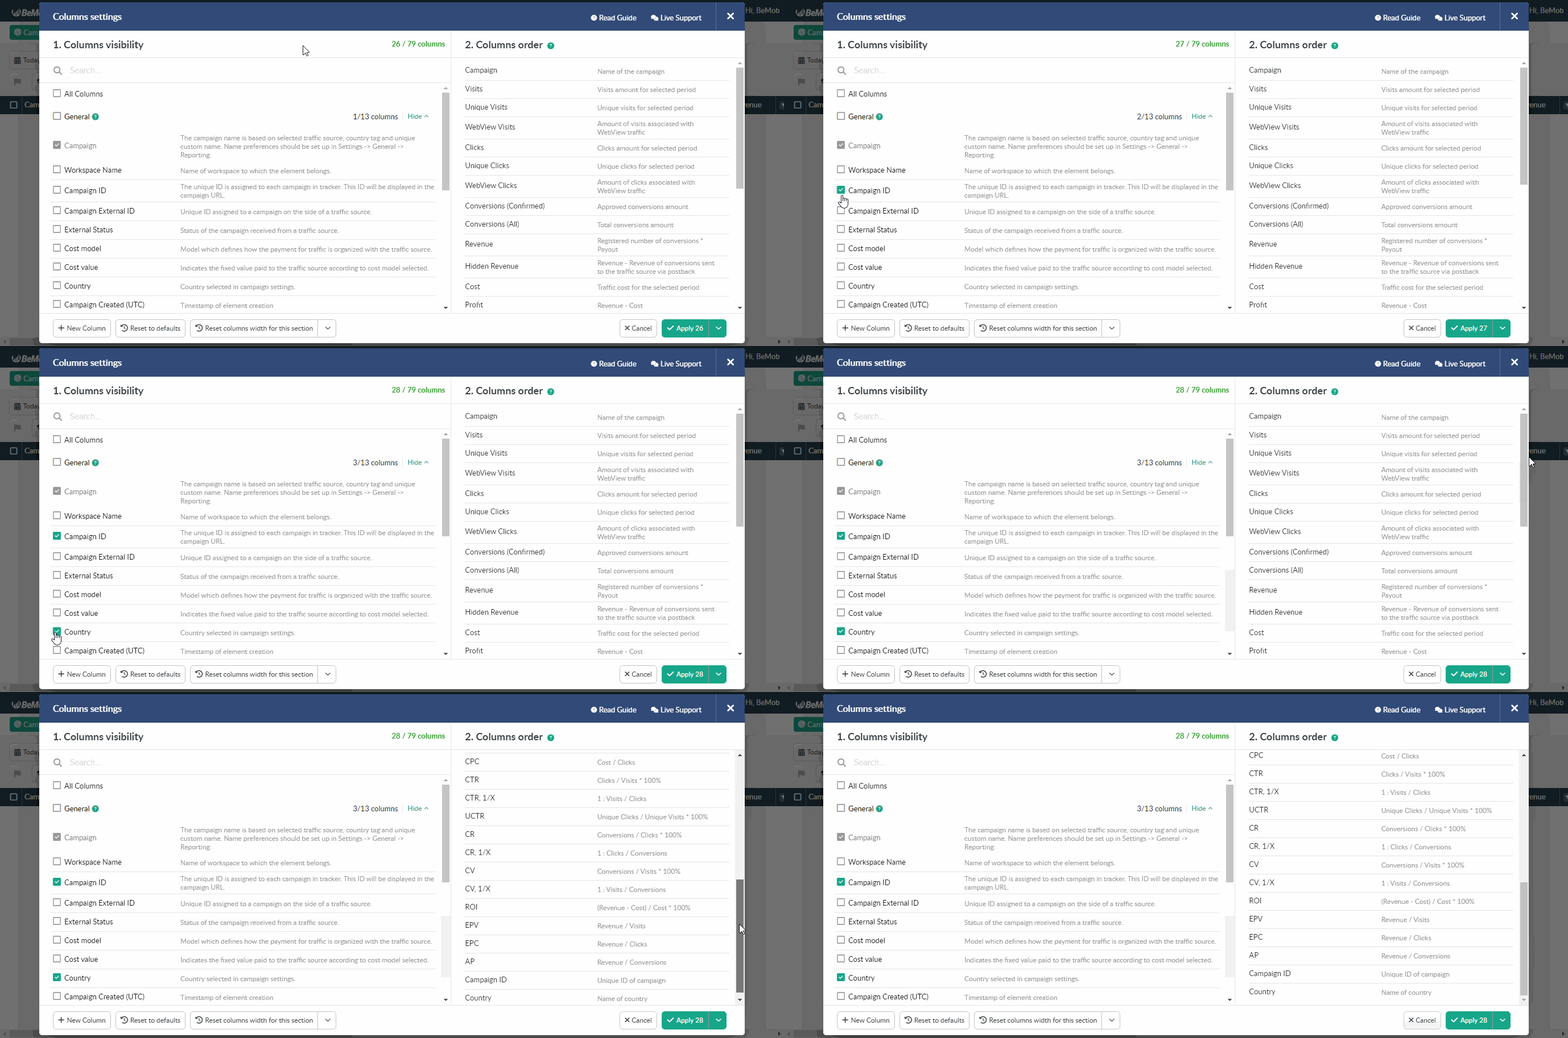
To select the required column for report tick the name on the left side of settings window. The column name will appear on the right side of the settings window immediately.
The column with report name located at the top of the General group of columns can not be unmarked.
Actions which can be performed with the columns:
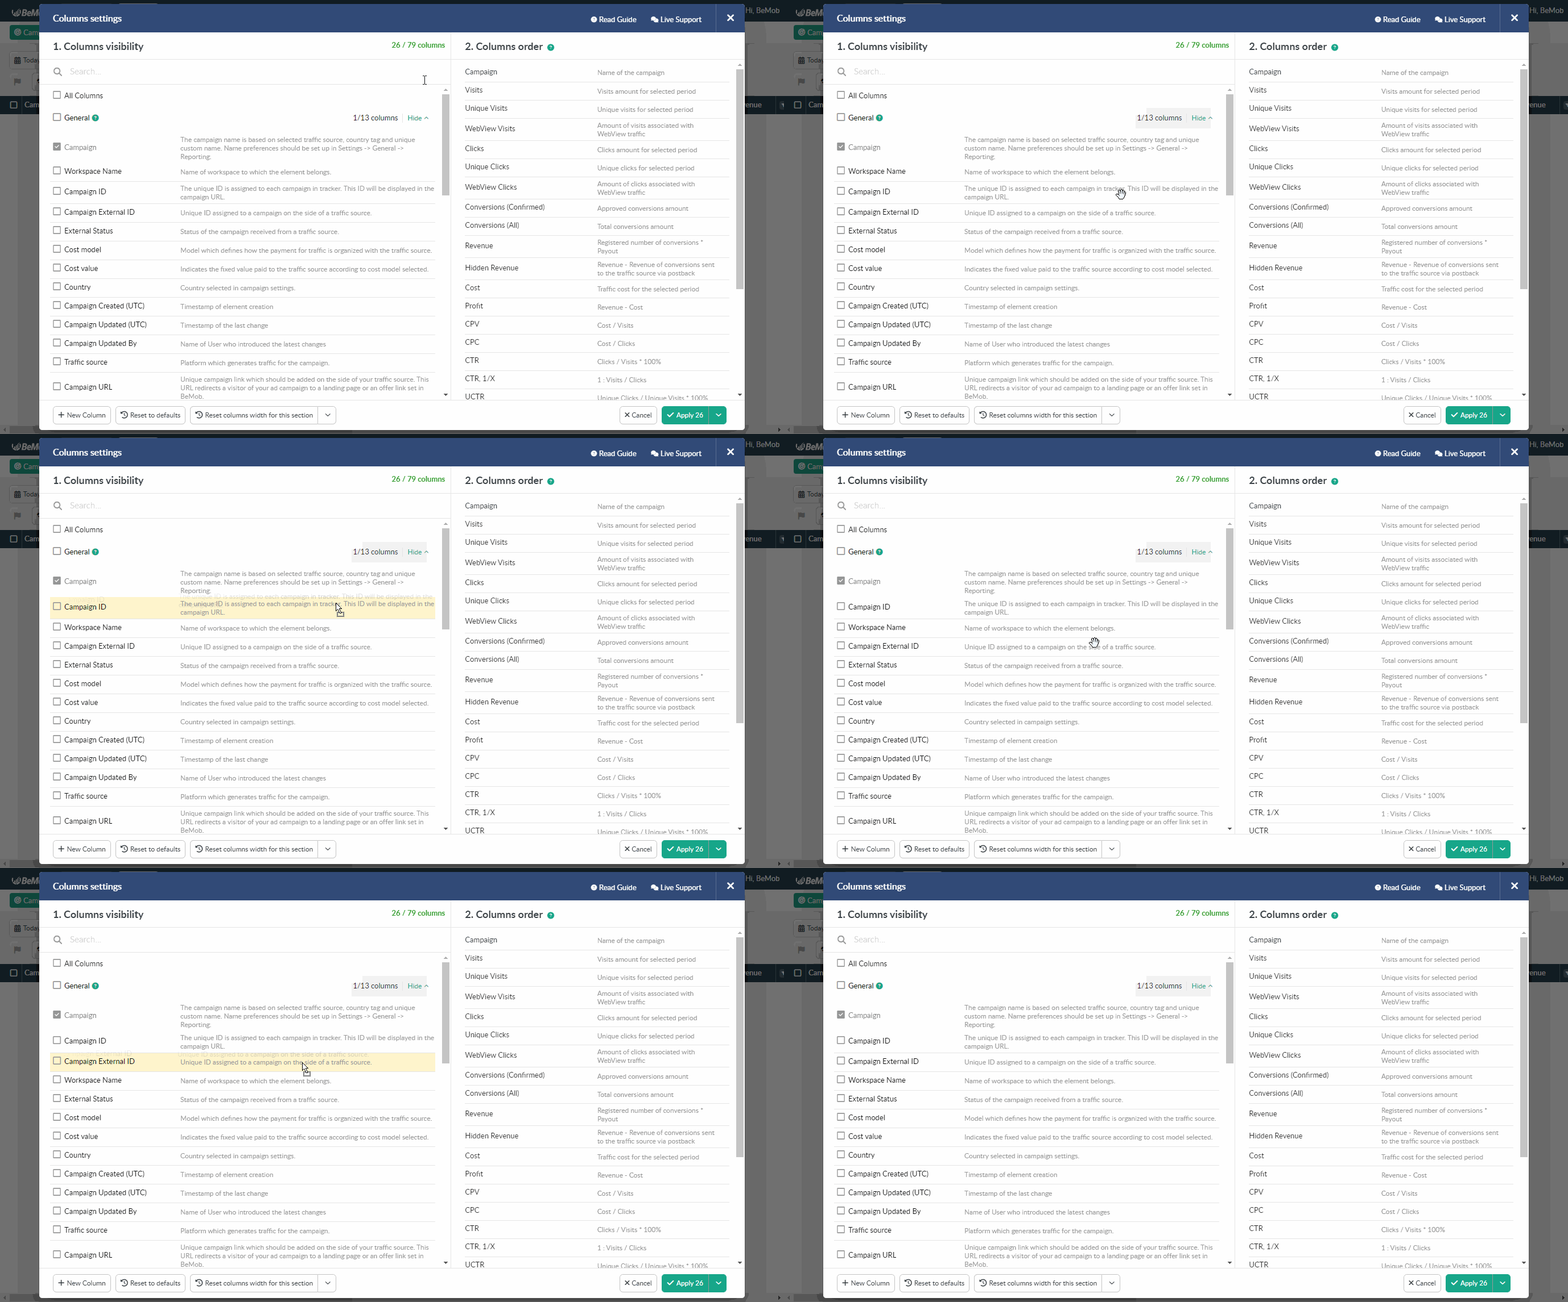
- changing columns order
You can change the order of columns inside of a certain group by dragging them up or down.
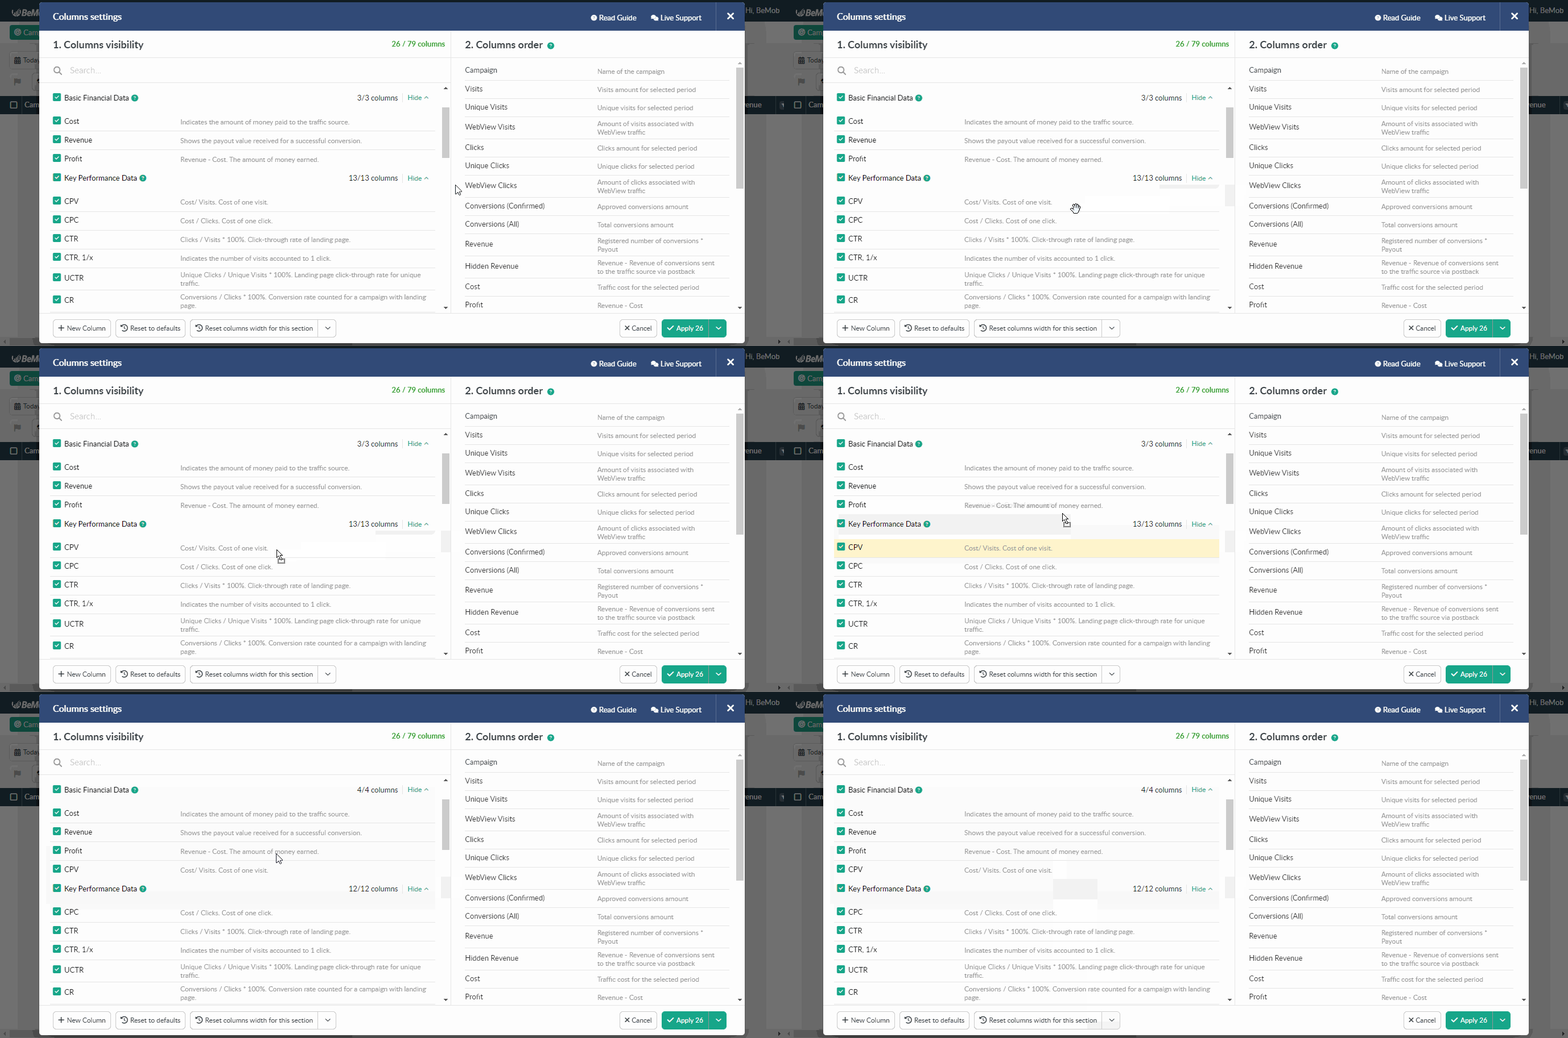
- changing column group
It's possible to change a column group by dragging it from one group to another.
- search
For easy navigation through the list of columns introduce a part or complete name of the required column.

- bulk selection
Checking All Columns mark box you can make all available columns be displayed in reports.
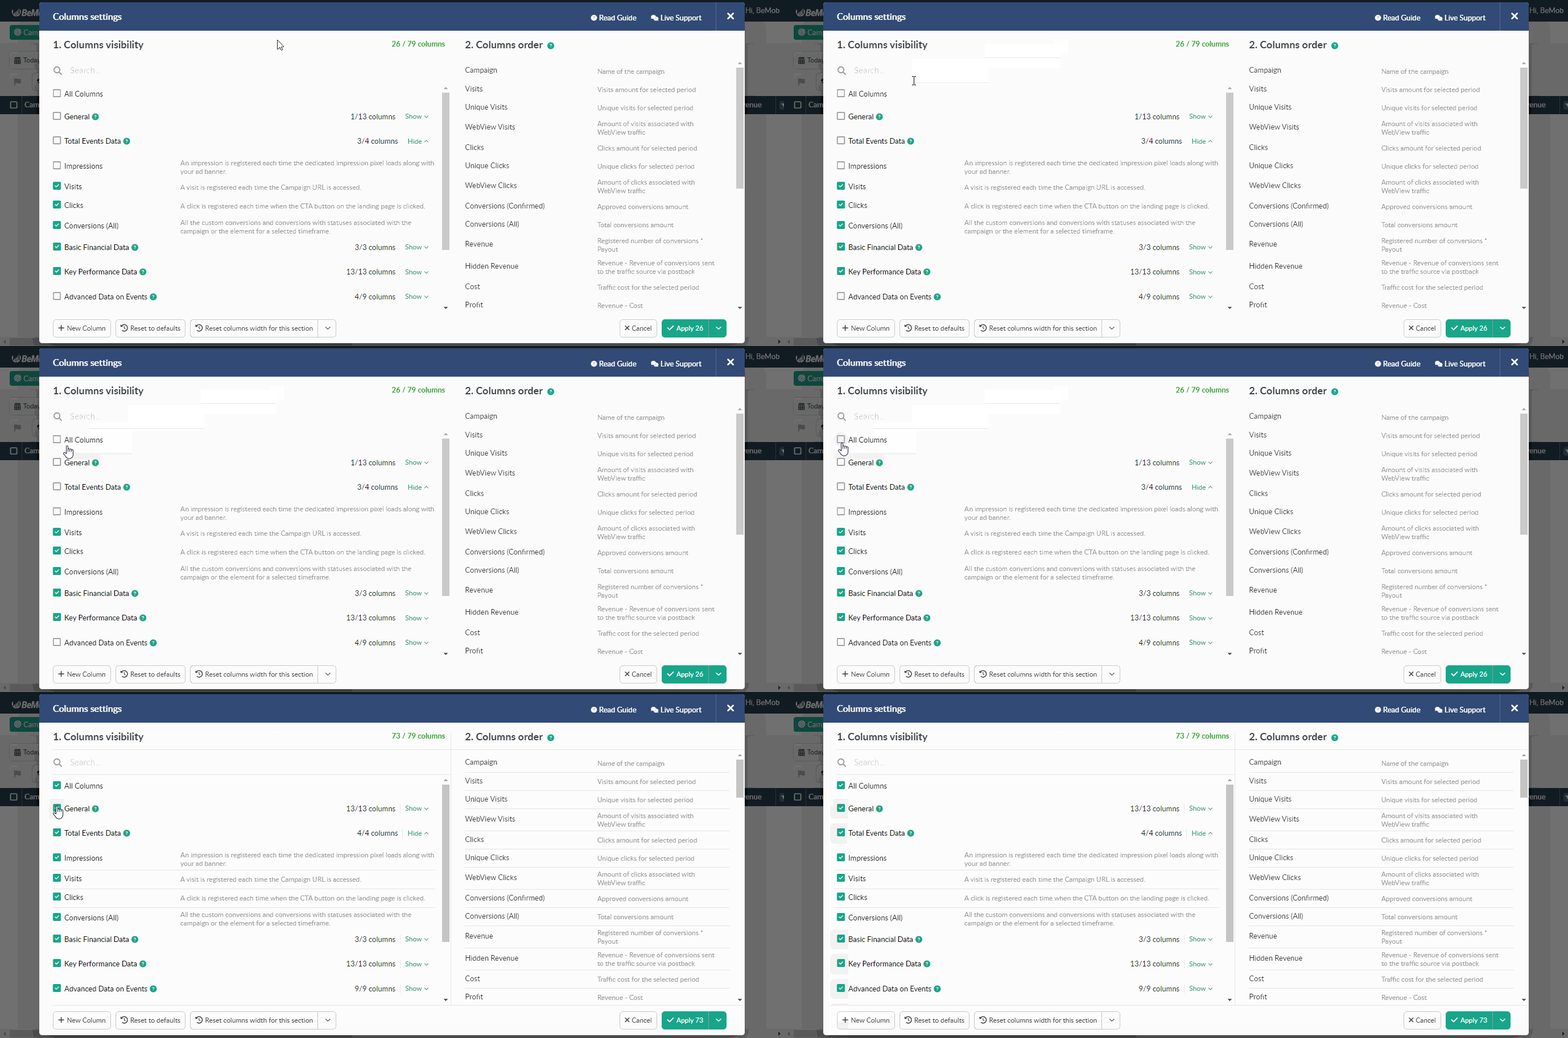
- reset to default order
You can easily uncheck all the columns you selected pressing Reset to defaults button.
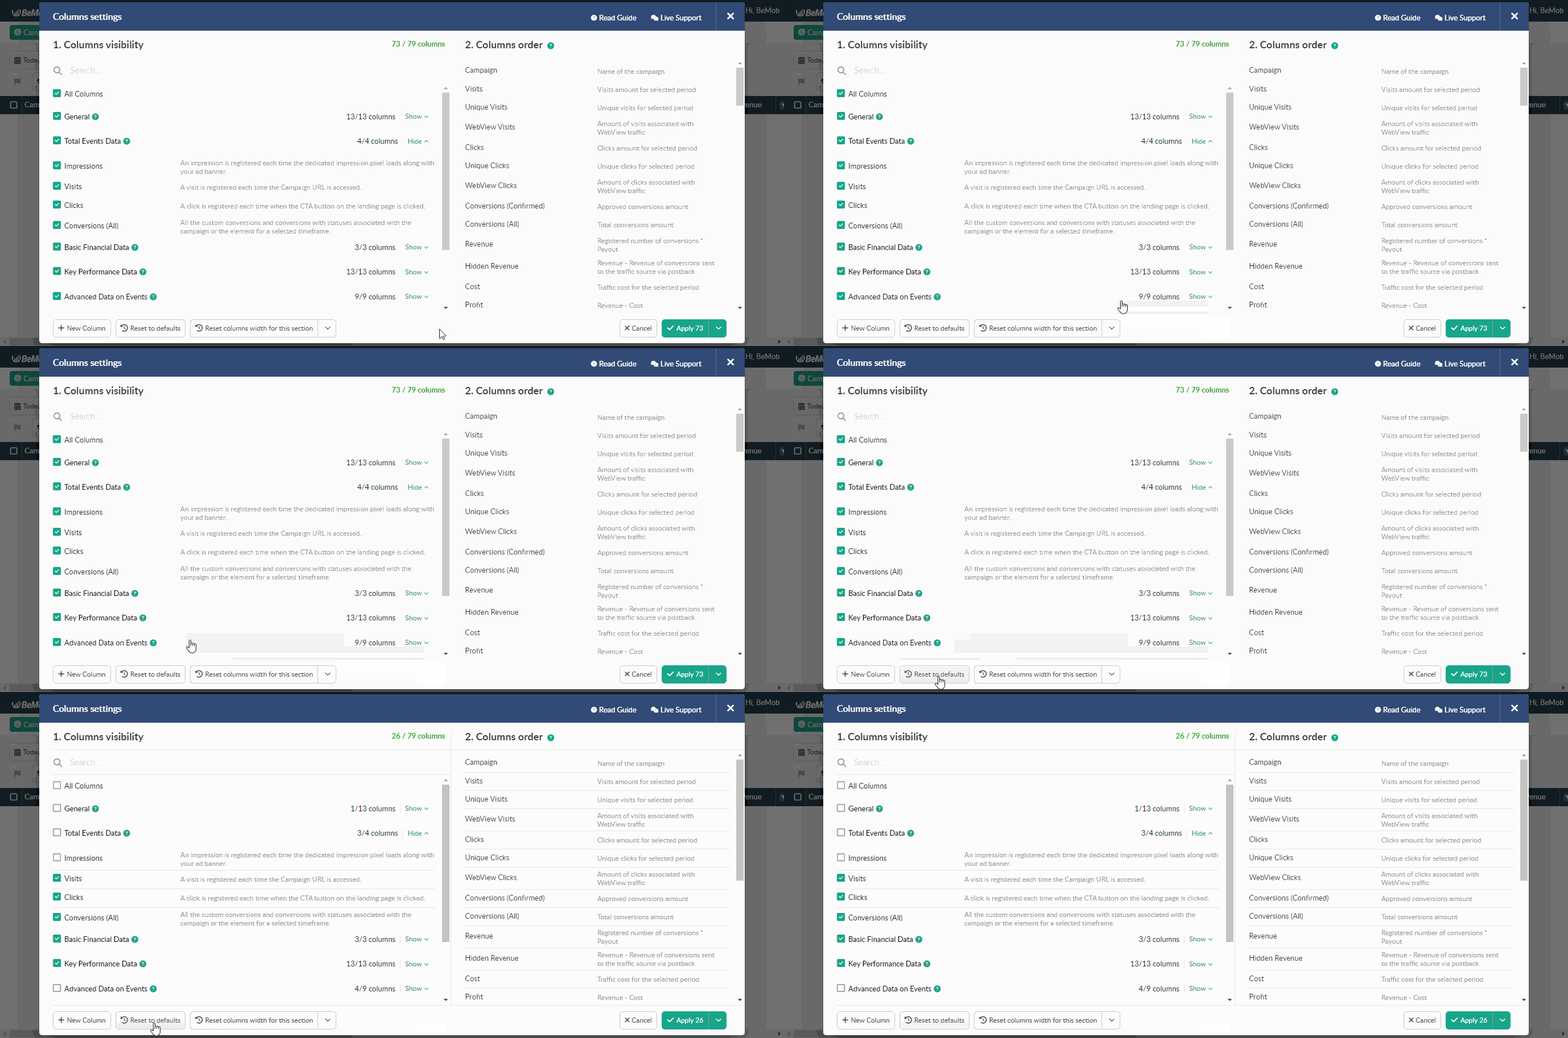
¶ Columns Order
The columns order in the report can be changed. It is required to drag columns up or down to change their order.
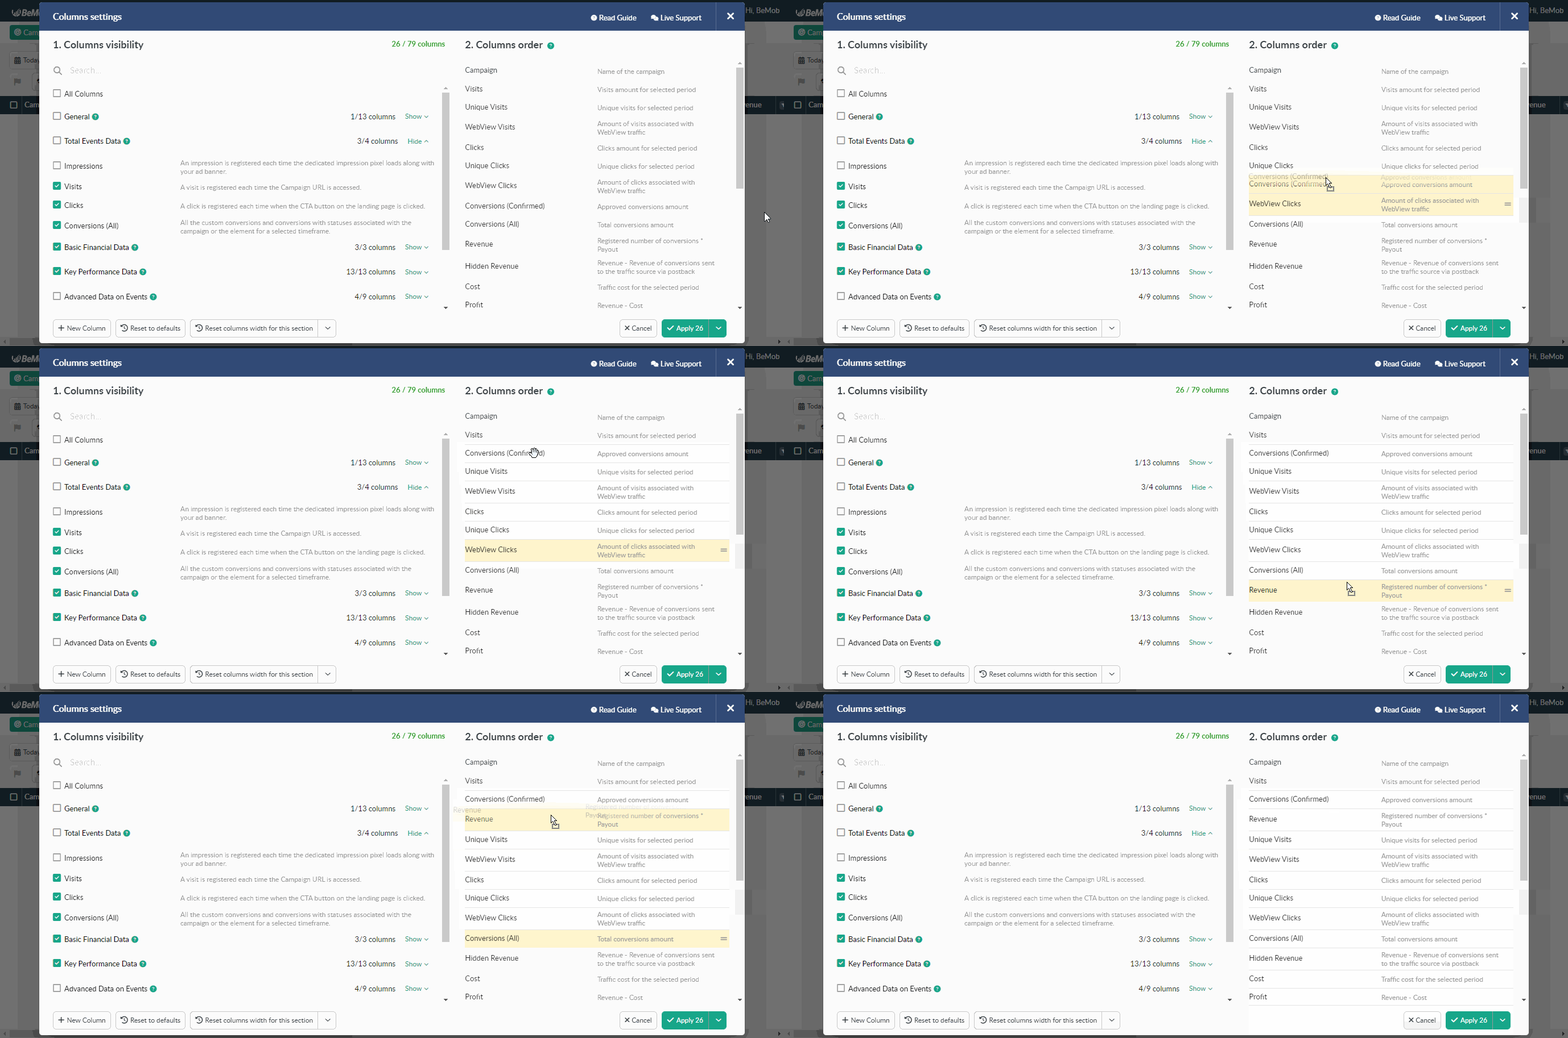
The order of columns you set will be applied to the corresponding report only.
e. g. if you set columns order in Campaigns section it will be applied for the report grouped by Campaigns.
You can see the number of columns you want to be visible on Apply button. Press it to store the settings.
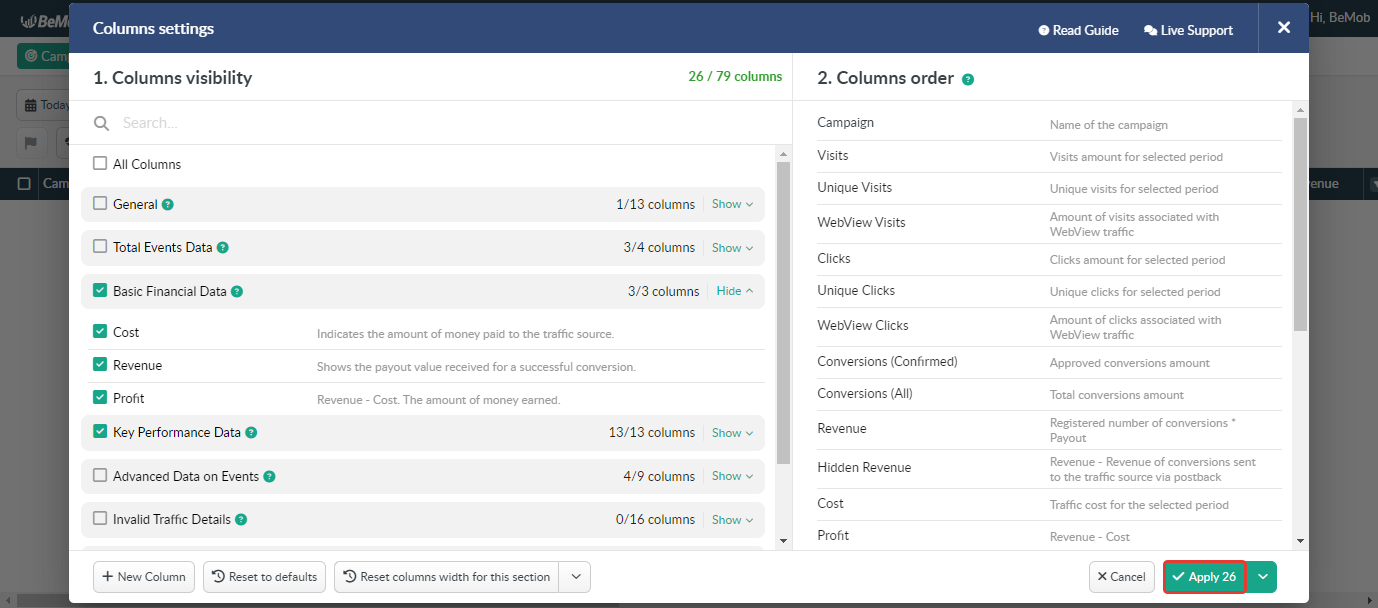
¶ Columns Sorting
By default the columns sorting is organized by Visits column.
The campaign or its element with the highest traffic volumes will be at the top of report.
This sorting rule is applicable to all the reports sections excepting Errors, Live Visits, Live Clicks, Conversions where the sorting is based on timestamp data.

If Visits column is disabled for report, then the sorting will be performed according to the next column with the highest priority. For instance, if Visits is not available in report, the sorting will be based on Profit column. If Profit column is not available, the sorting will be done on ROI column.
The priority of columns available for report:
- 1 - Visits
- 2 - Profit
- 3 - ROI
- 4 - Clicks
- 5 - Conversions (Confirmed)
- 6 - Revenue
- 7 - Cost
- 8 - Unique Visits
- 9 - Unique Clicks
- 10 - Impressions
- 11 - CPV
- 12 - CPC
- 13 - CTR
- 14 - AP
- 15 - CR
- 16 - CV
If the report contains no prioritized column, the sorting will be based on the first order column.

¶ Columns Settings
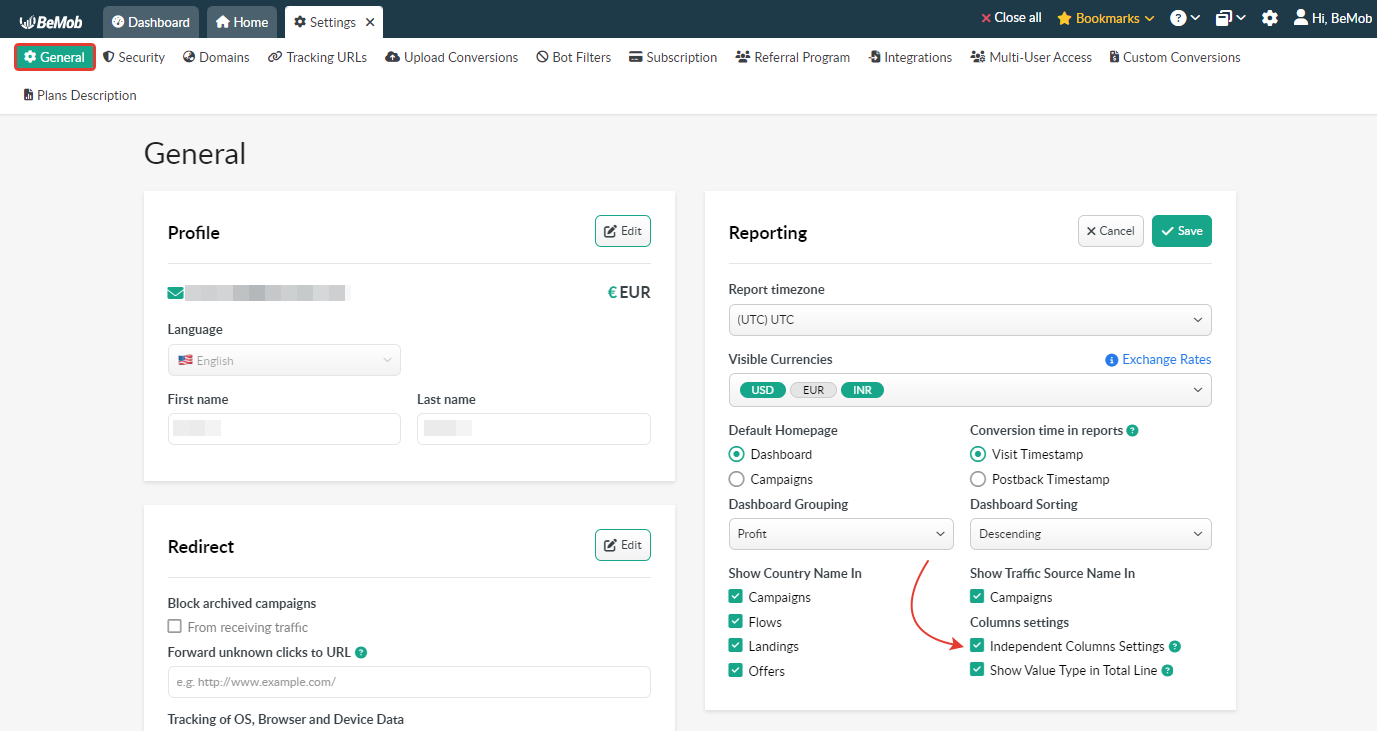
This option allows to customize the columns settings in your BeMob account:
- go to Settings;
- access General section.
¶ Independent Columns Settings Option is Switched On
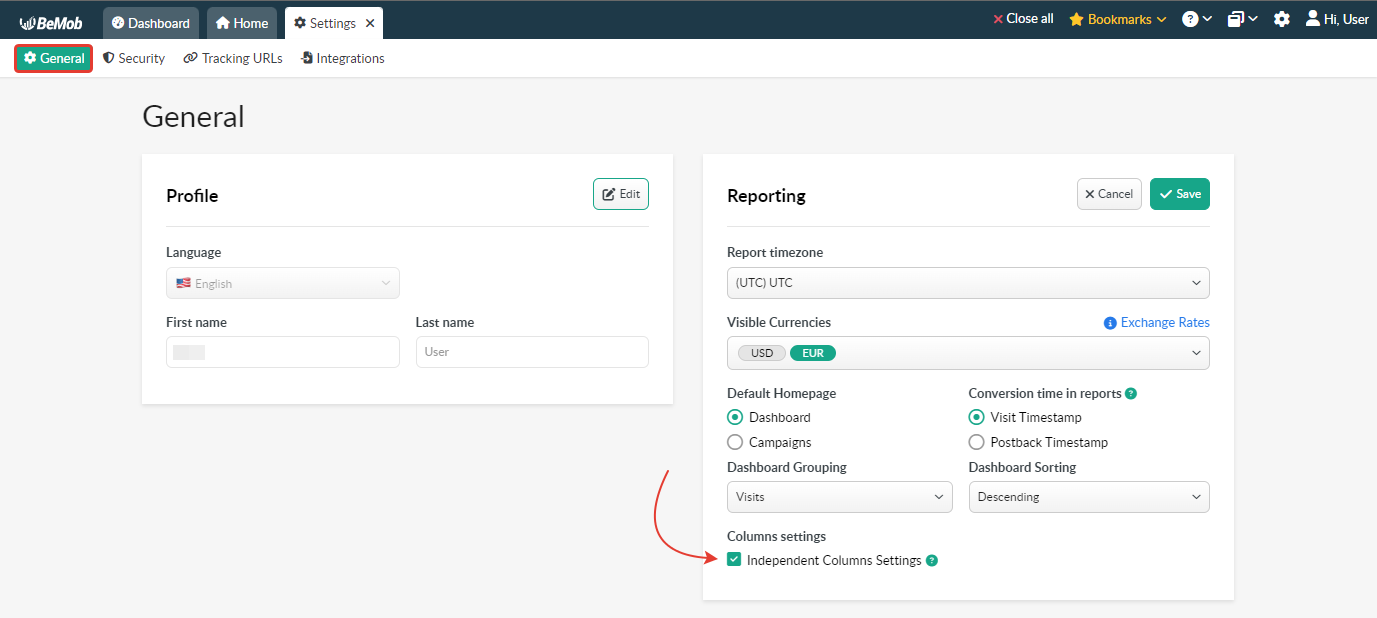
By default Independent Columns Settings option is ticked.
It means that the columns settings work for each tab separately. It is flexible and allows you to have the unique columns set per each tab.
To access the columns settings it is required to click the eye icon on the right side of the panel.
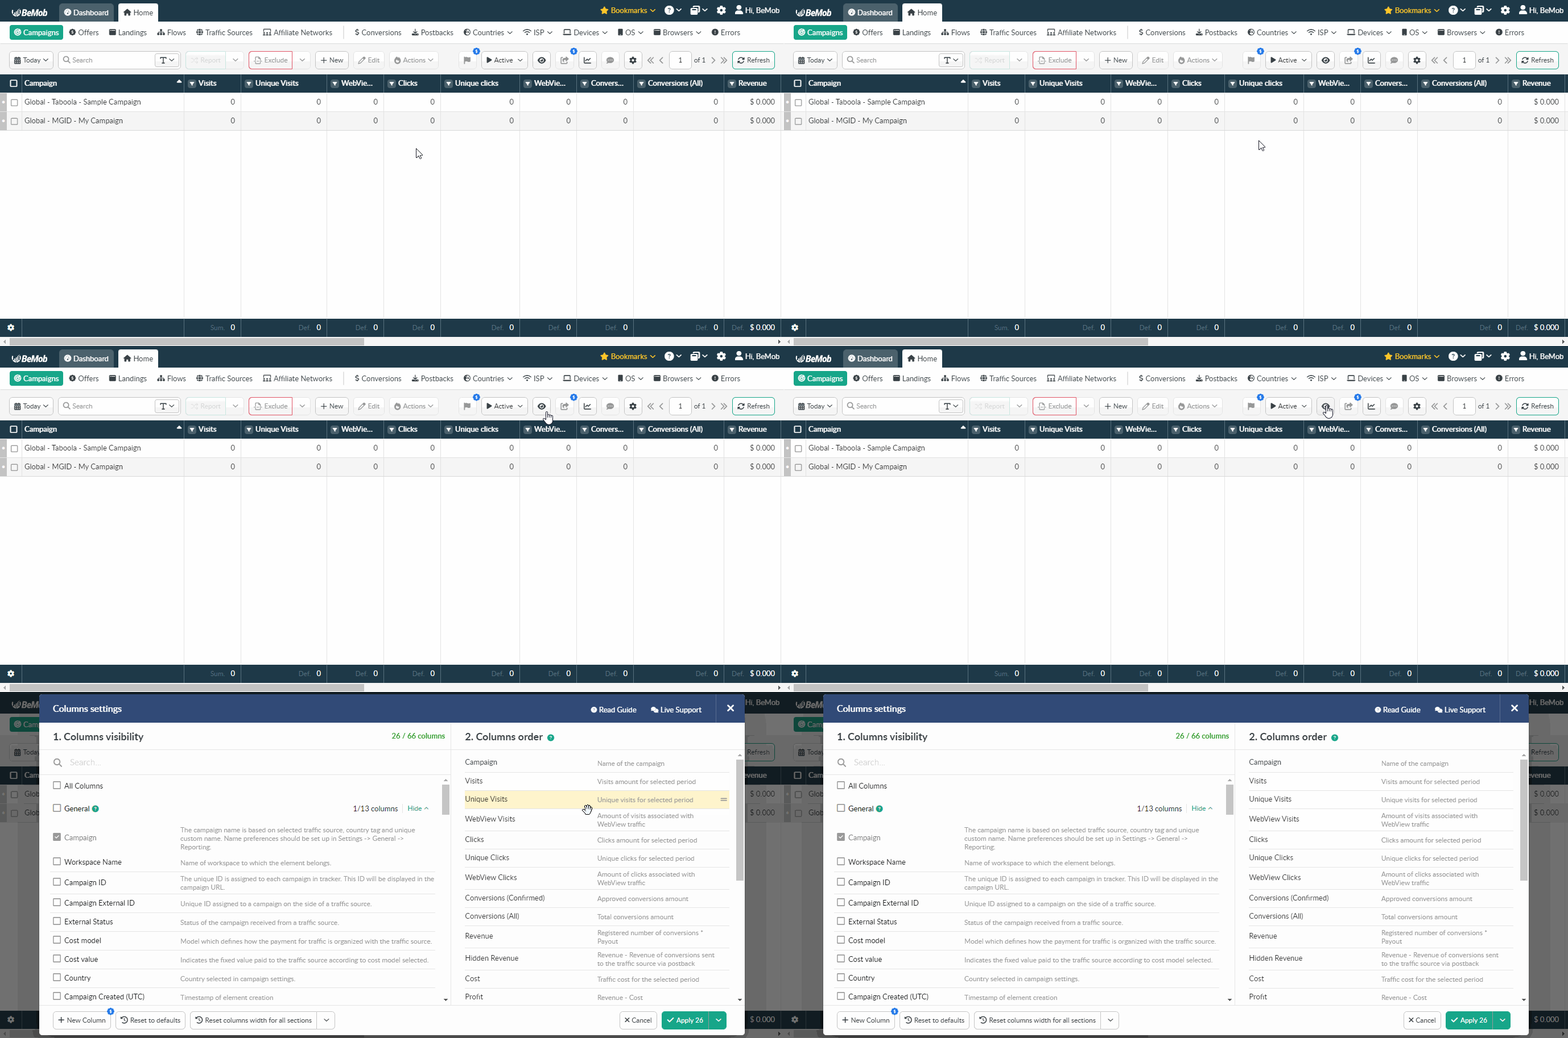
There are two buttons available under Apply:
-
Apply button is used to apply changes to the current tab only;
-
Apply To All Sections button is used to apply the selected columns to all related tabs.
Related tabs include Campaigns, Traffic sources, Affiliate networks, Offers, Flows, Landings, Countries, ISP, Devices, OS and Browsers tabs and all their categories.
Conversions, Postbacks, Live visits/ clicks and Errors tabs have their unique columns set and work separately giving you only one Apply button.
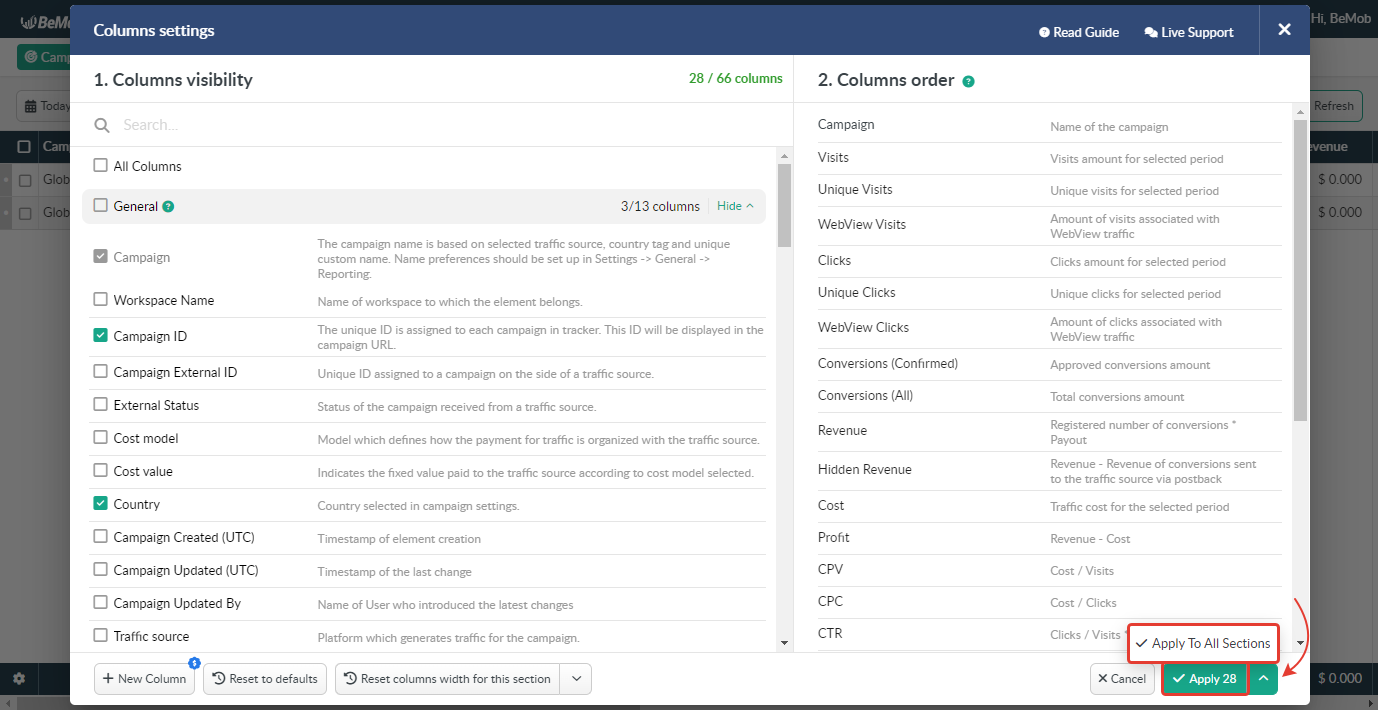
Once the required columns order and number are configured you can click on Apply or Apply To All Sections.
If Apply is clicked the selected columns number and order will be applied to the current tab only.
If Apply To All Sections button is clicked the columns will be remembered for all related tabs in this report.
There are the same two buttons inside the report. They affect the current report only. Apply button applies changes to the current tab inside this exact report and Apply To All Sections button affects all related tabs.
All columns set up inside the report will not be saved once you close the report.
¶ Columns Width
Columns width can be changed for all columns.
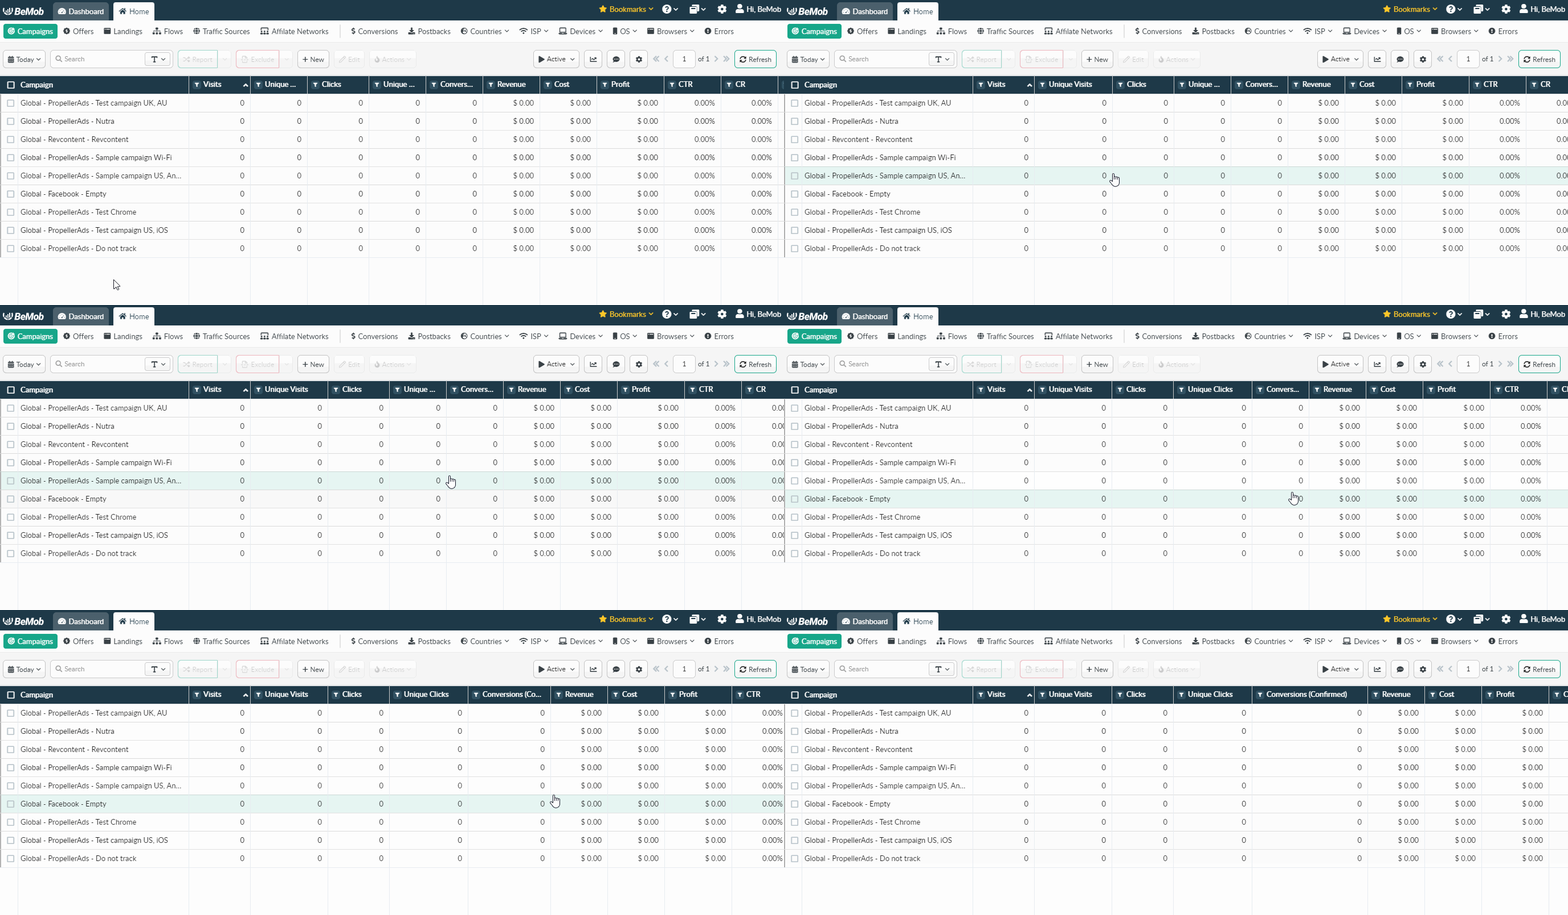
With Independent Columns Settings ticked columns width is applied to the current tab only. The width set up on one tab will not remembered for any other related tab or reports.
To reset the width to the default value it is possible to use one of the following options:
-
Reset Columns Width For This Section button which is used to reset columns width to the default value for the current tab;
-
Reset Columns Width For All Sections button which resets the width for all related tabs.
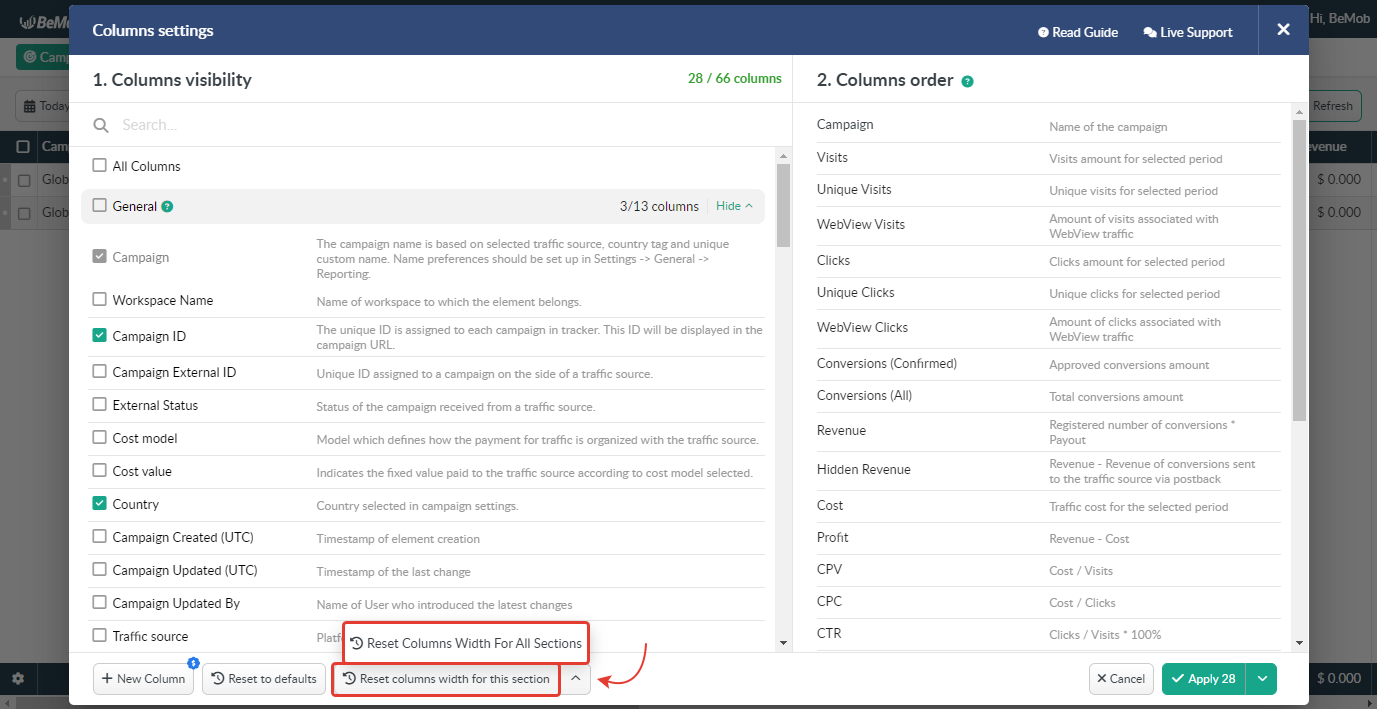
The same way it works when the report is extracted from one of the tabs. Both columns settings and reset width option work independently and allow to have the personalized columns selection and columns width under each tab.
The columns width set up inside the report will not be saved once you close the report.
¶ Independent Columns Settings Option Is Switched Off
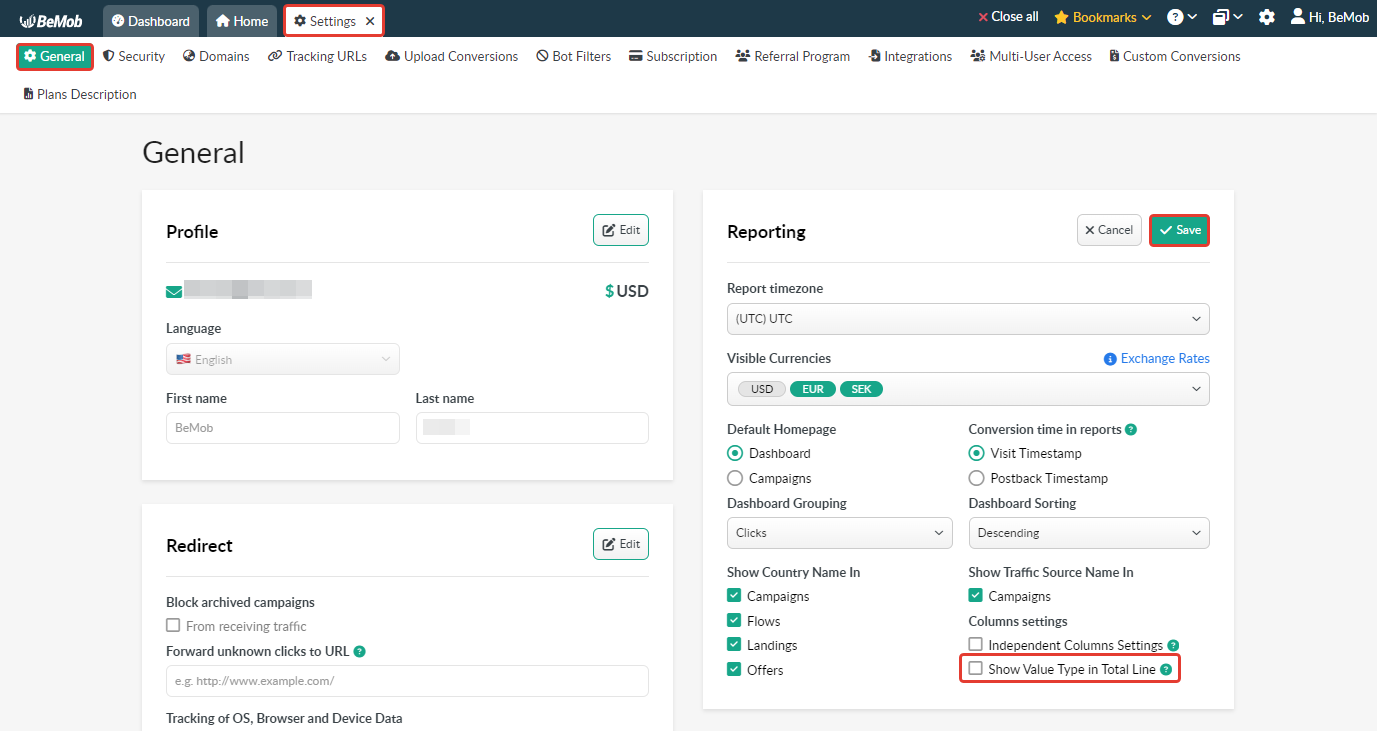
To have the same columns settings, their order and width for all the tabs, you should unmark the Independent Columns Settings option.
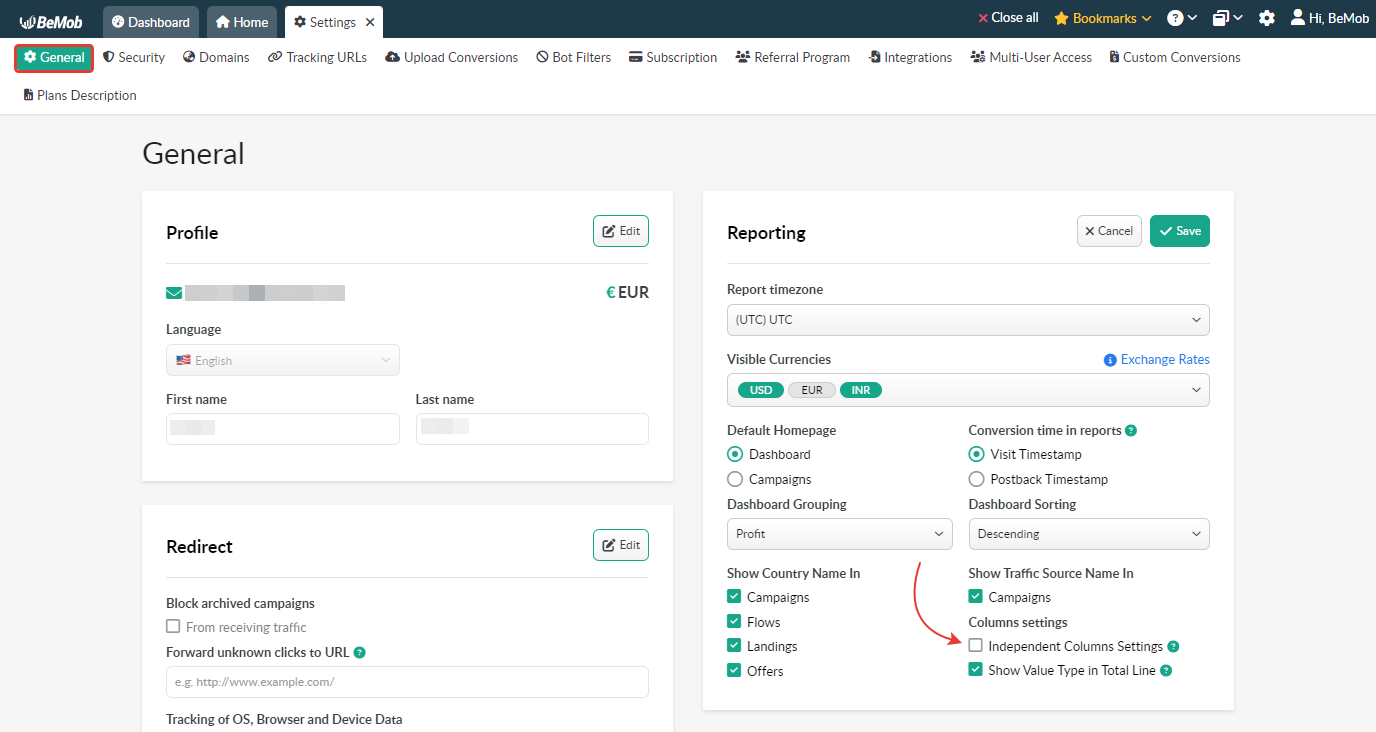
In the columns settings there are two buttons available under Apply:
-
Apply button is used to apply changes to all related tabs;
-
Apply To This Section button is used to apply changes to the tab you are currently viewing.
Related tabs include Campaigns, Traffic sources, Affiliate networks, Offers, Flows, Landings, Countries, ISP, Devices, OS and Browsers tabs and all their categories.
Conversions, Postbacks, Live visits/ clicks and Errors tabs have their unique columns set and work separately giving you only one Apply button.
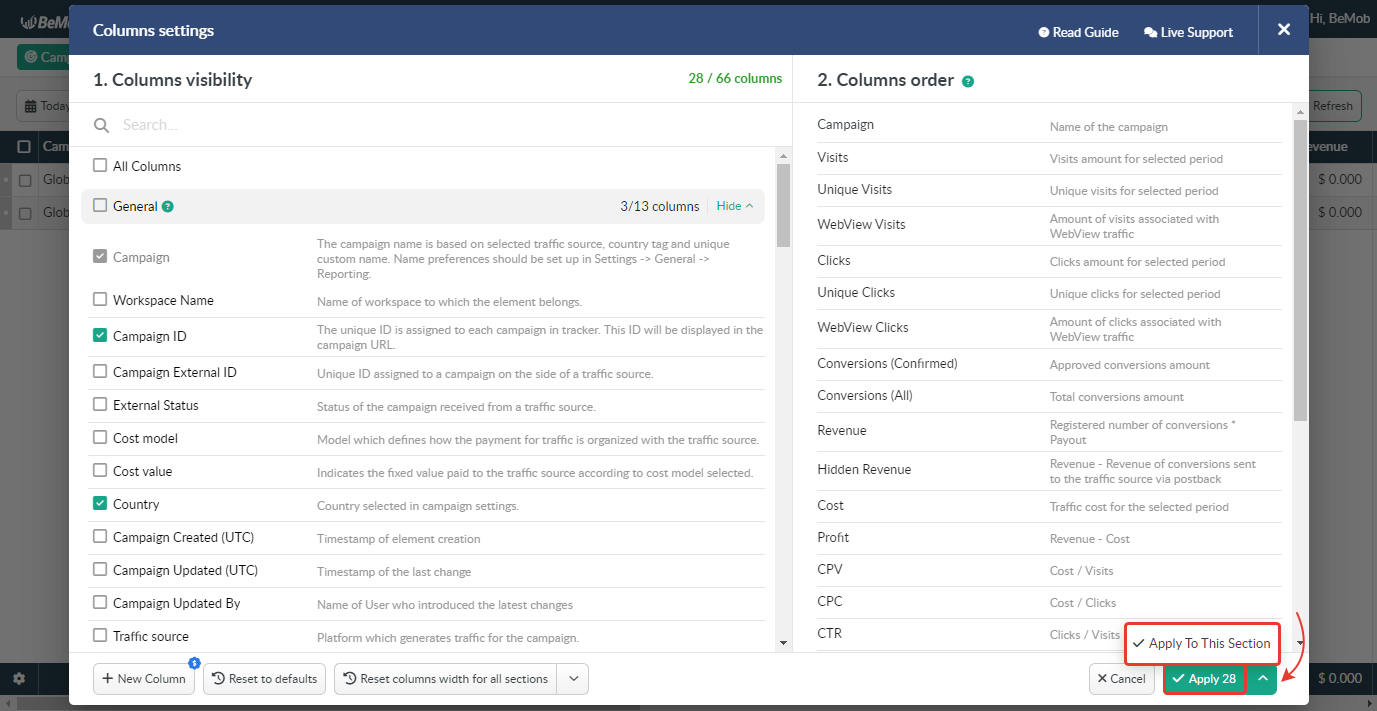
When you select the required columns and apply them to all related tabs, all reports accessed from any of the tabs will contain the same set of columns.
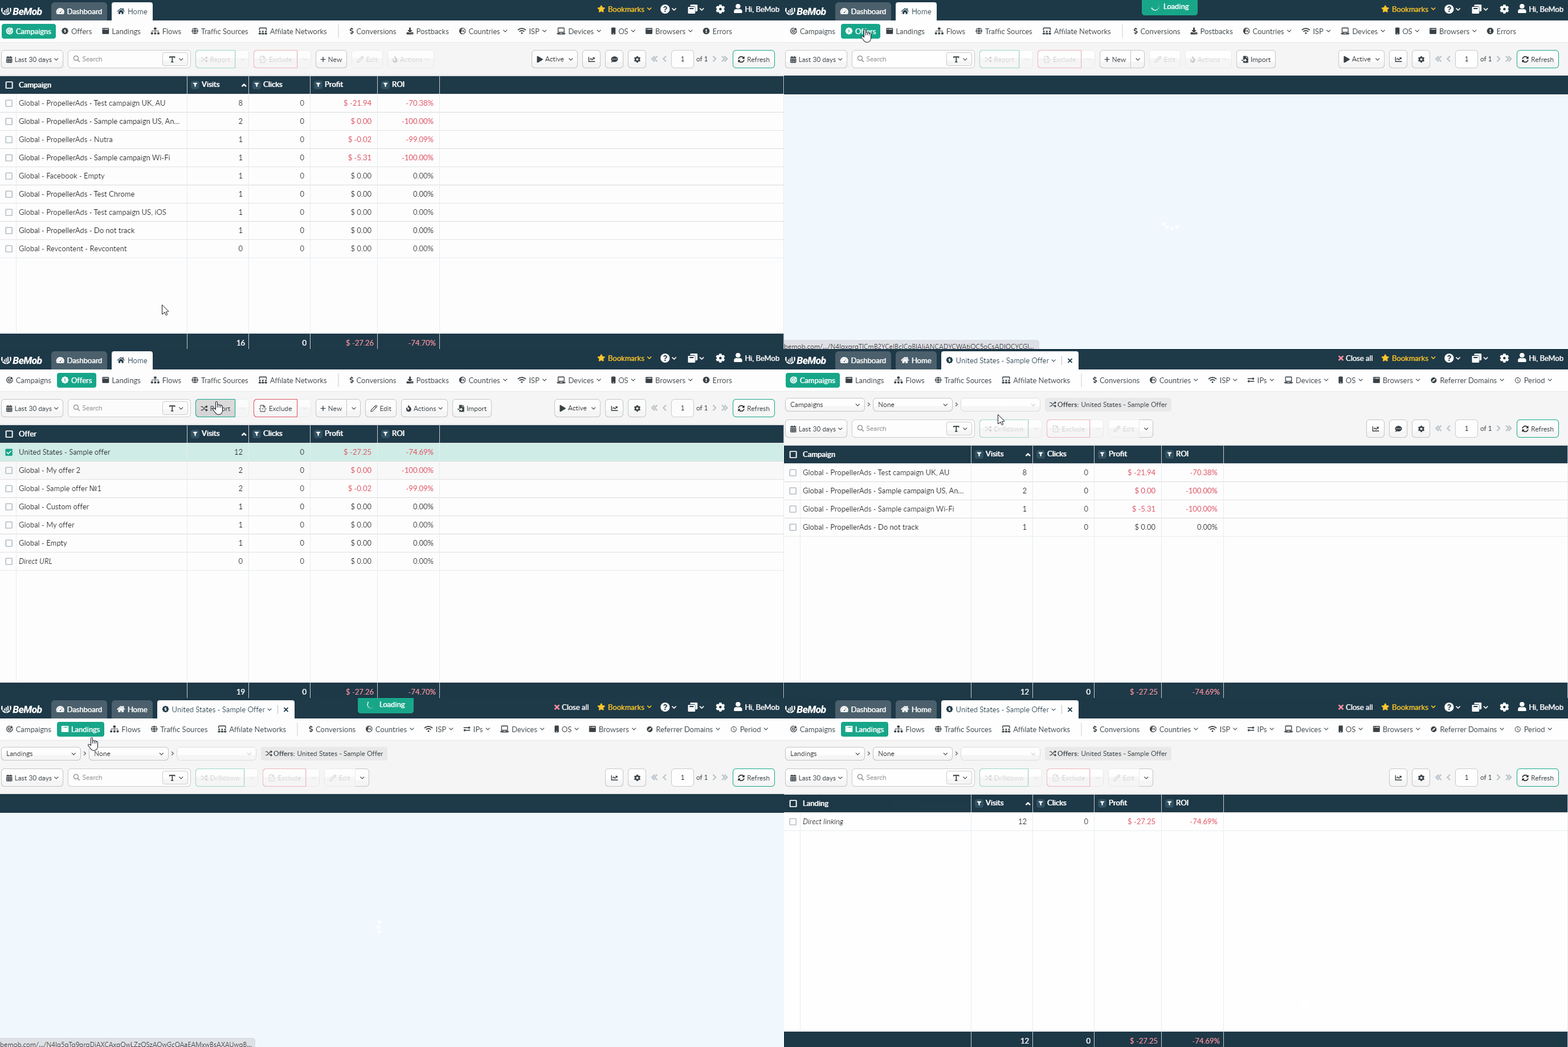
When the selected columns are applied to one of the tabs only and the report accessed from that tab, the columns set under that tab will be displayed in the report (including all related tabs).
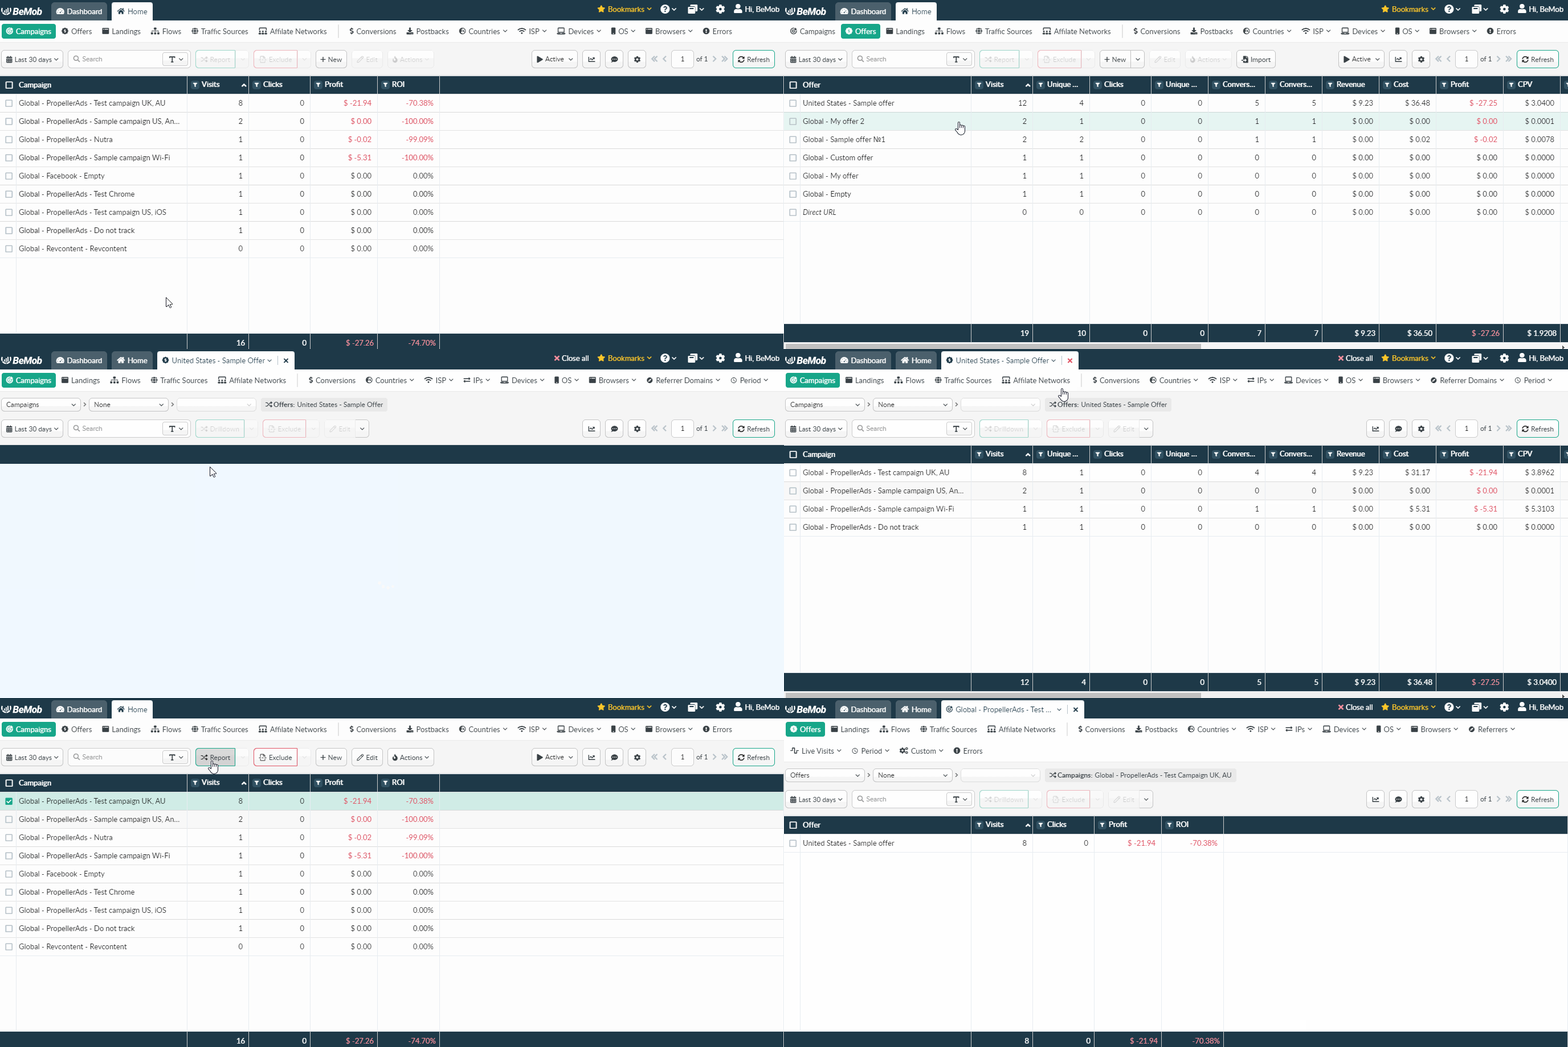
There are the same two buttons inside the report. They affect the current report only.
Apply button is used to apply changes to all related tabs and Apply To This Section applies the changes to the current tab.
All columns set up inside the report will not be saved once you close the report.
¶ Columns Width
Columns width can be changed for all columns.

With Independent Columns Settings switched off columns width is applied to all related tabs. When you set it under one tab, the same columns width is remembered for other related tabs.
To reset the width to the default value, use one of two buttons under columns settings.
-
Reset Columns Width For All Sections button resets the width for all the tabs;
-
Reset Columns Width For This Section button is used to reset columns width to the default value for the current tab only.
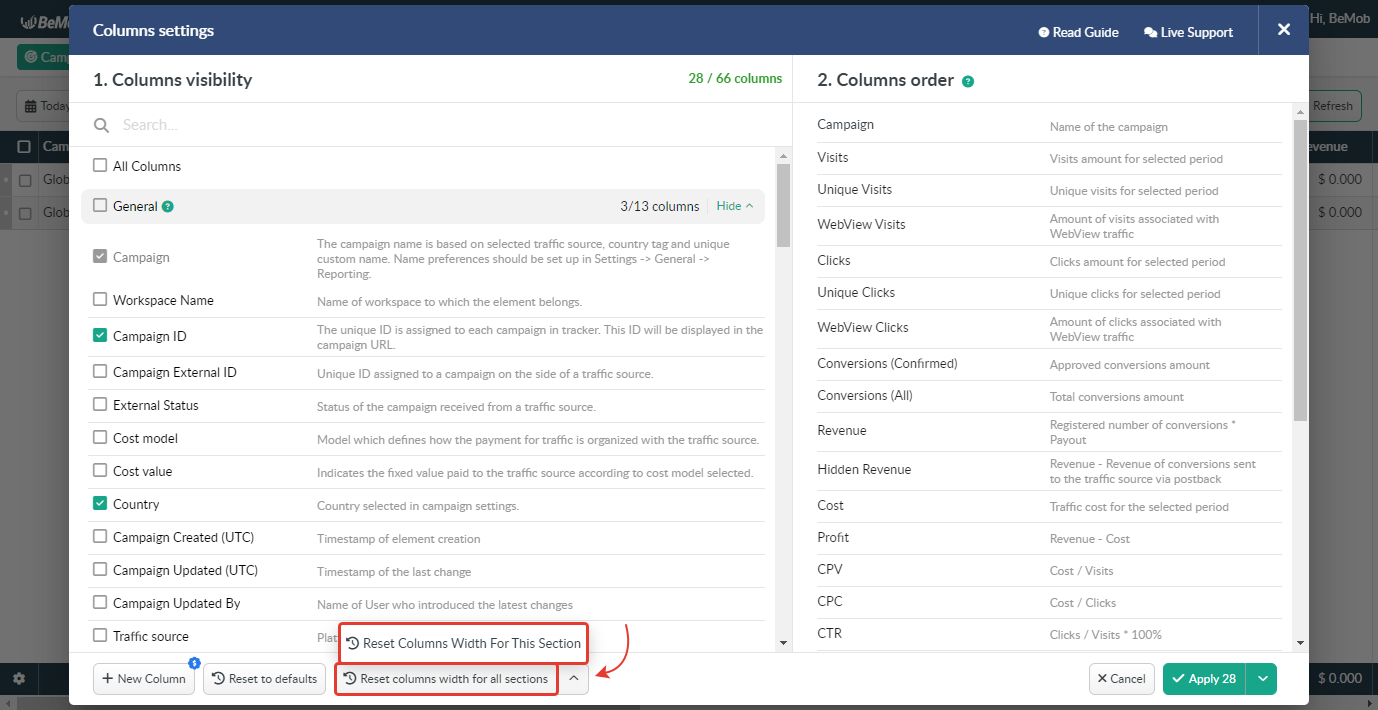
Columns settings are stored on the side of server. It means that when you change the columns in your BeMob account, your choice will be remembered on all other browsers and devices.
¶ Multi-User Access
Independent Columns Settings feature is available for both admins and users when you work with Multi-user Access.
It works completely the same and independently from the account of the owner.
Each admin or user can have their own columns settings according to the preferences.
To change the default columns settings:
- go to Settings;
- then select General.
Enable or disable Independent Columns Settings feature to customize columns settings.
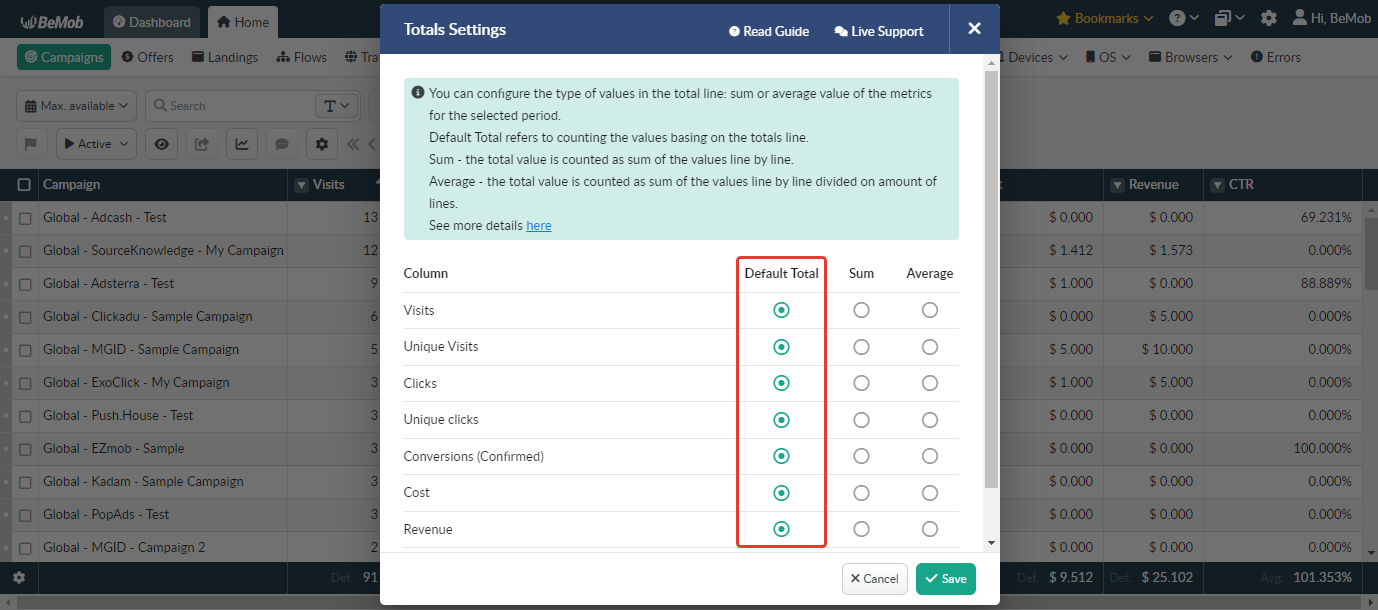
¶ Totals Settings
Totals Settings allow you to select the type of values displayed in the total line: default total, sum or average value of the metrics for a certain period.
The settings are applicable to the columns displaying data in numeric, currency and percentage format.
To access the Total Settings click the gear icon available in the lower left corner of your screen.
![]()
¶ Default Total
Default Total is a total value calculated as sum of the values based on the totals line.
Example:
CTR = Clicks / Visits * 100%
Campaign 1
CTR = 3 clicks / 3 visits * 100% = 100%Campaign 2
CTR = 2 clicks / 2 visits * 100% = 100%Default Total CTR = (Campaign 1 clicks + Campaign 2 clicks / Campaign 1 visits + Campaign 2 visits) * 100% = (3 clicks + 2 clicks / 3 visits + 2 visits) * 100% = 5 clicks / 5 visits * 100% = 100%
¶ Sum
Sum is a total value calculated as sum of the values line by line.
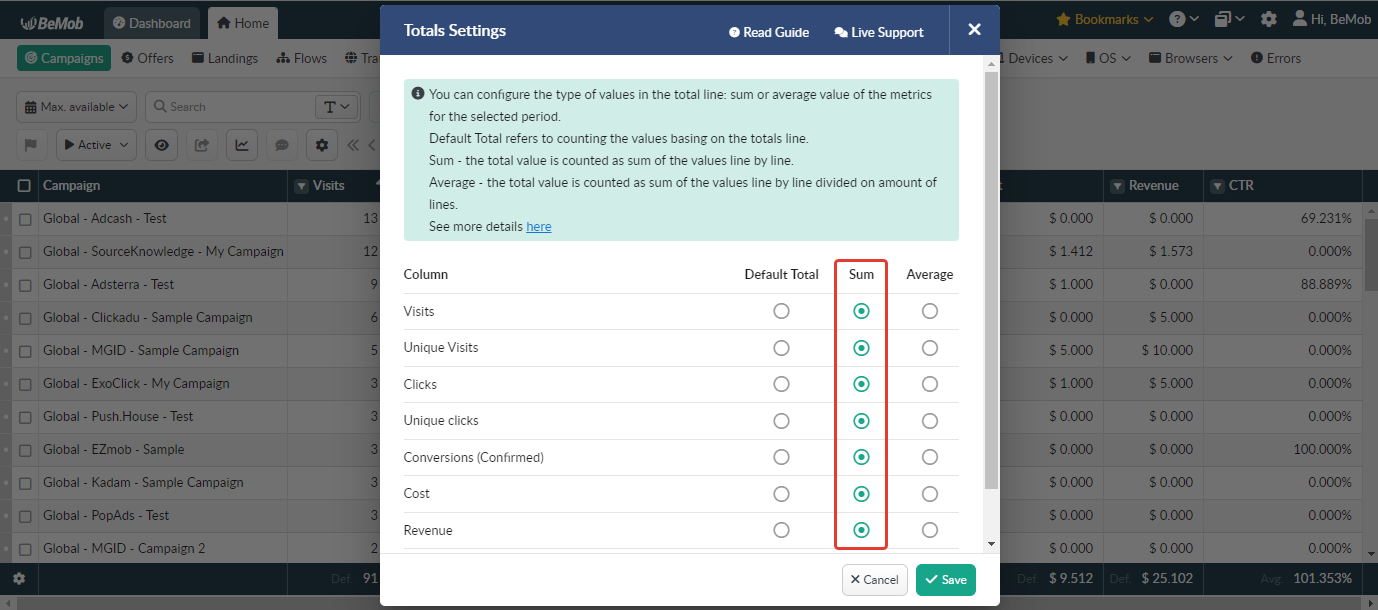
Example:
CTR = Clicks / Visits * 100%
Campaign 1
CTR = 3 clicks / 3 visits * 100% = 100%Campaign 2
CTR = 2 clicks / 2 visits * 100% = 100%Sum CTR = Campaign 1 CTR + Campaign 2 CTR = 100% + 100% = 200%
¶ Average
Average is a total value calculated as sum of the values line by line divided on the amount of lines.
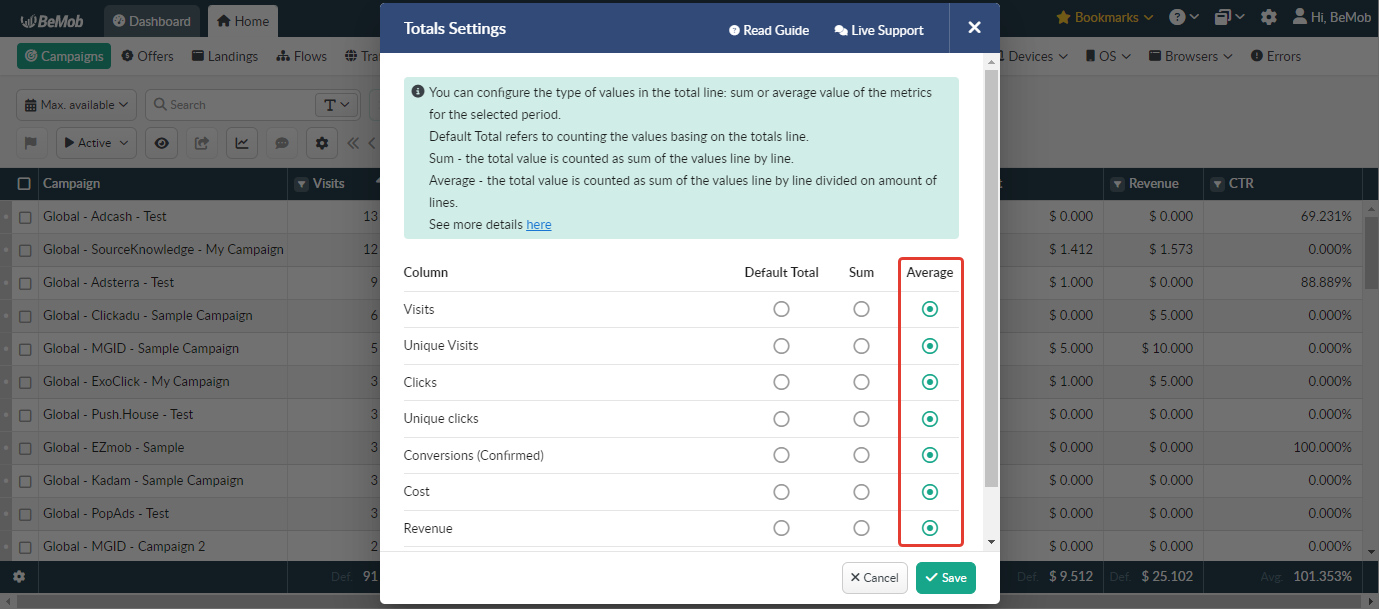
Example:
CTR = Clicks / Visits * 100%
Campaign 1
CTR = 3 clicks / 3 visits * 100% = 100%Campaign 2
CTR = 2 clicks / 2 visits * 100% = 100%Average CTR = (Campaign 1 CTR + Campaign 2 CTR) / 2 = (100% + 100%) / 2 = 100%
The settings will be applied to all your reports if the Independent Columns Settings option is switched off.
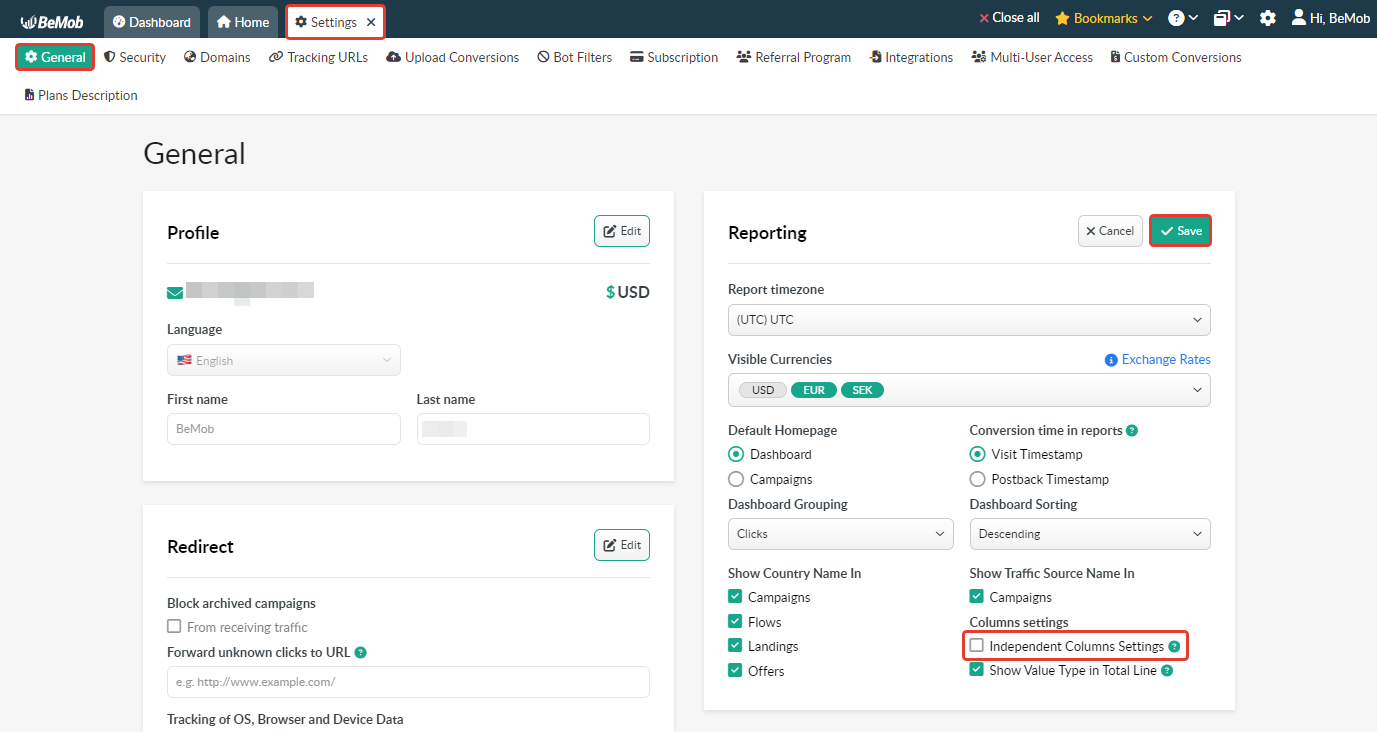
If you want to hide the name of value type selected for the total line, it is required to switch the Show Value Type in Total Line option off in the General Settings.
If you have any questions or need the assistance with the settings, contact our support team through the live chat or at support@bemob.com