¶ Overview
The Shared Reports feature in BeMob allows you to share specific reports with others without granting them access to your BeMob account.
You can create and to share up to 100 reports across different categories, making data analysis more accessible.
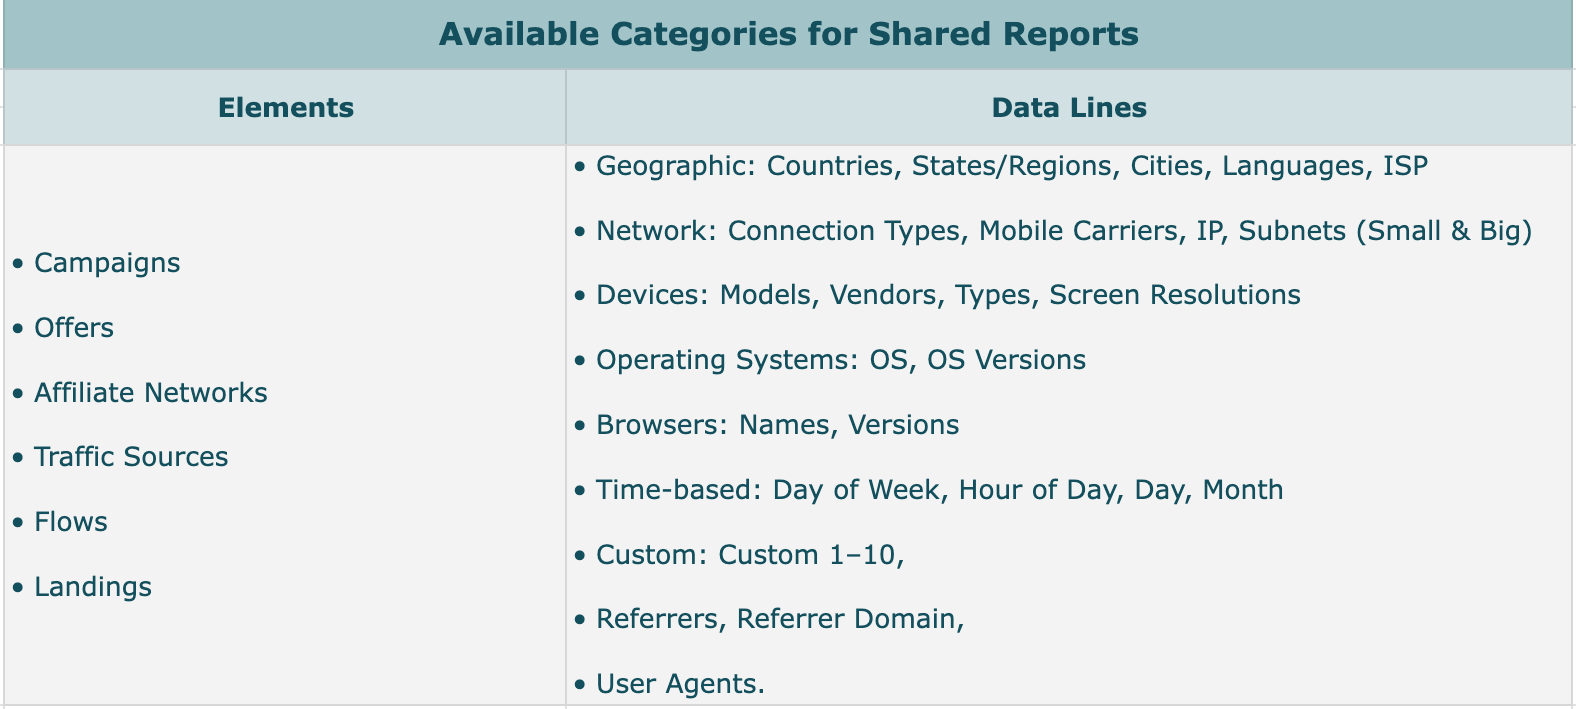
The reports can be created based on Elements and Data Lines:
Shared reports can be created for dynamic and fixed date ranges.
Dynamic Date Range:
• Today
• Yesterday
• Last 24 Hours
• Last 48 Hours
• Last 3 Days
• Last 7 Days
• Last 30 Days
• Last Month
• This Month
• Maximum period available (based on your data retention settings).
The data in this type of report updates dynamically based on the selected time range.
Example
• On March 19, you create a report for Yesterday, displaying data from March 18.
• When you access the report on March 20, it will now reflect data from March 19.
This pattern continues, ensuring the report always shows the most recent data for the chosen time frame.
Fixed Date Range:
• Manually select a specific period. In this case the data in the report will not change over time.
Shared reports are customizable, allowing control over: included data, time periods, displayed columns, time limit of availability.
Reports can be accessed via a shareable links in the section of Multi-User Access → Shared Reports.
You can edit, delete the reports and adjust accessibility settings. More details see below in Manage Shared Report part.
Permissions & Restrictions
Only account owners or admins can create shared reports.
Reports can be generated for all general and detailed reports, except:
• Postbacks
• Conversions
• Live Visits
• Live Clicks
• Errors
💲 The Shared Reports are available on the Business and Enterprise plans. On Free and Professional plans can be purchased as an addon.
¶ Create Shared Report
To create a shared report:
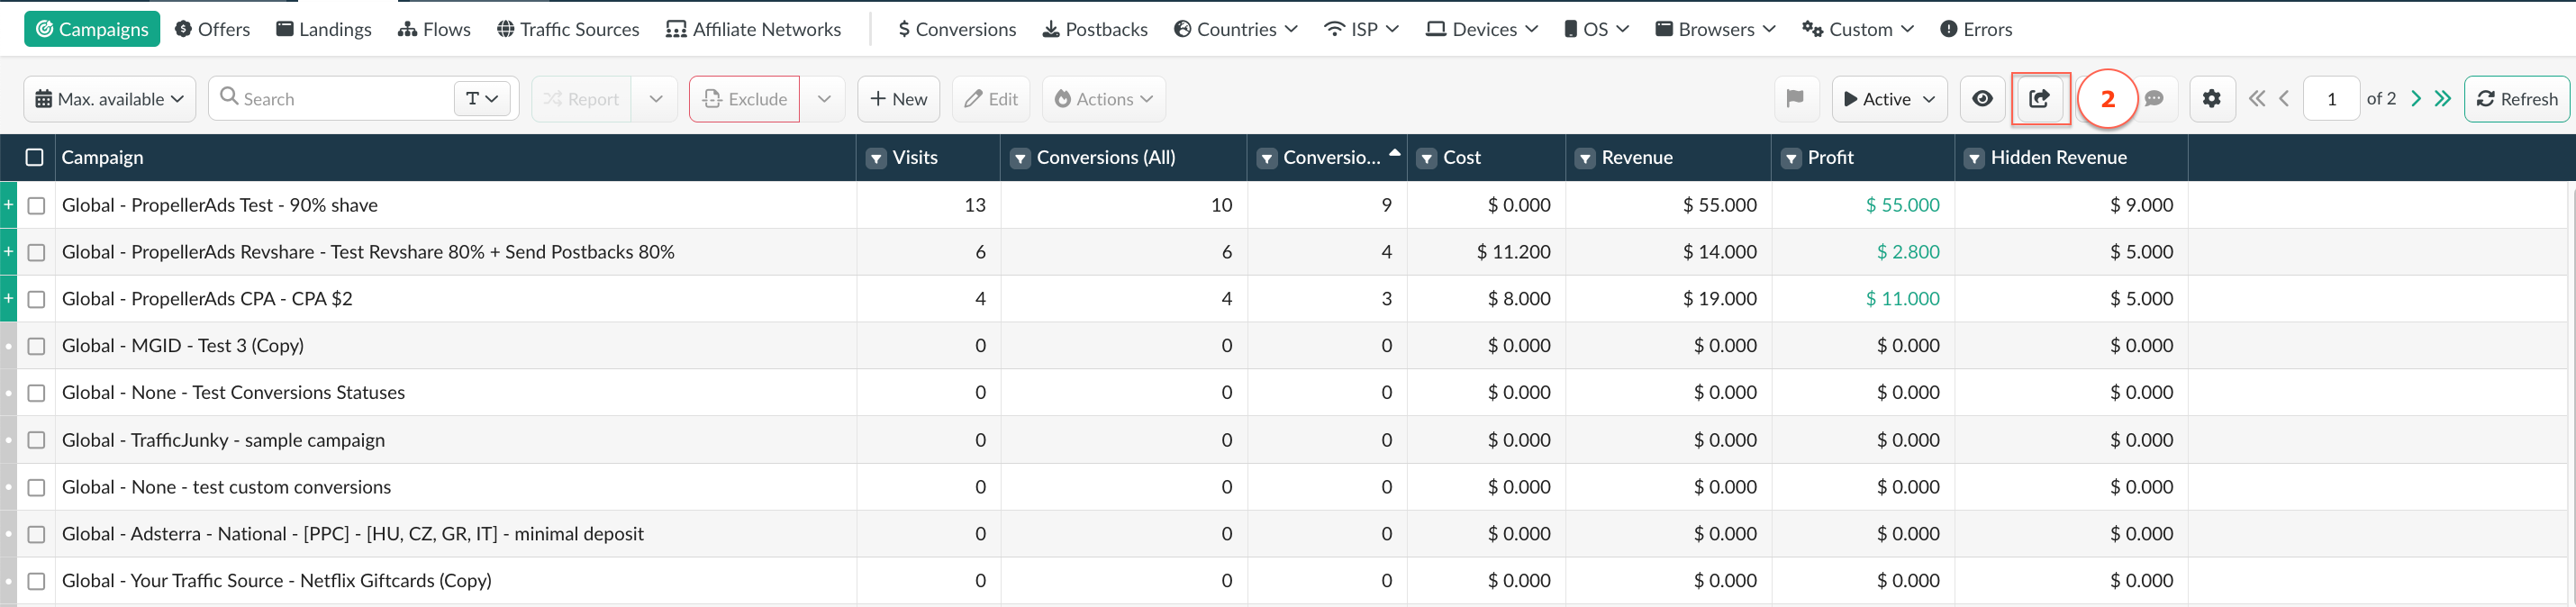
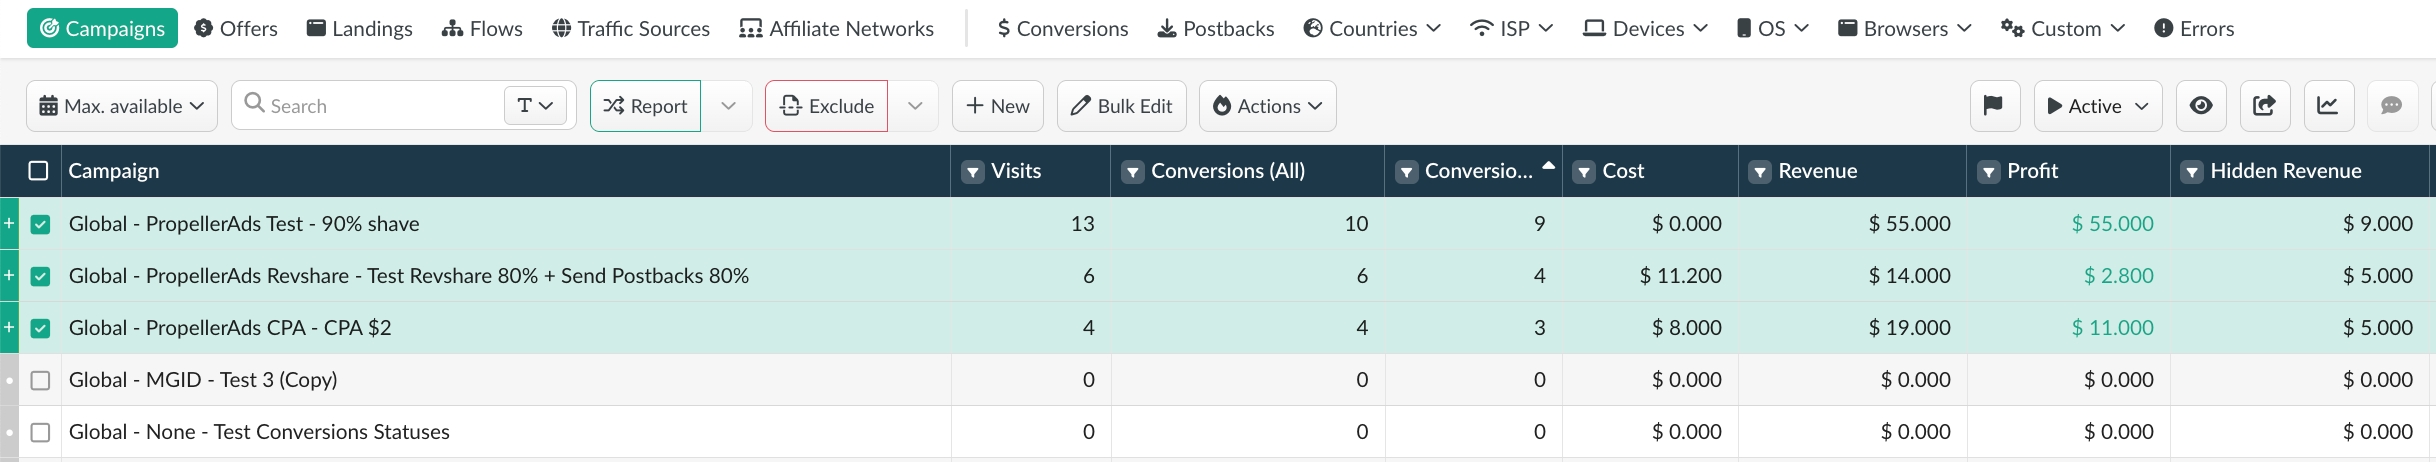
1. Go to the required report tab.
2. Click on Share Report icon to share the all the data on the page.
3. To share data on one or more elements, first select the elements you want to include in the report.
After selecting them, click on the Share Report icon to initiate the sharing process. This allows you to generate a report with the chosen data for sharing purposes.
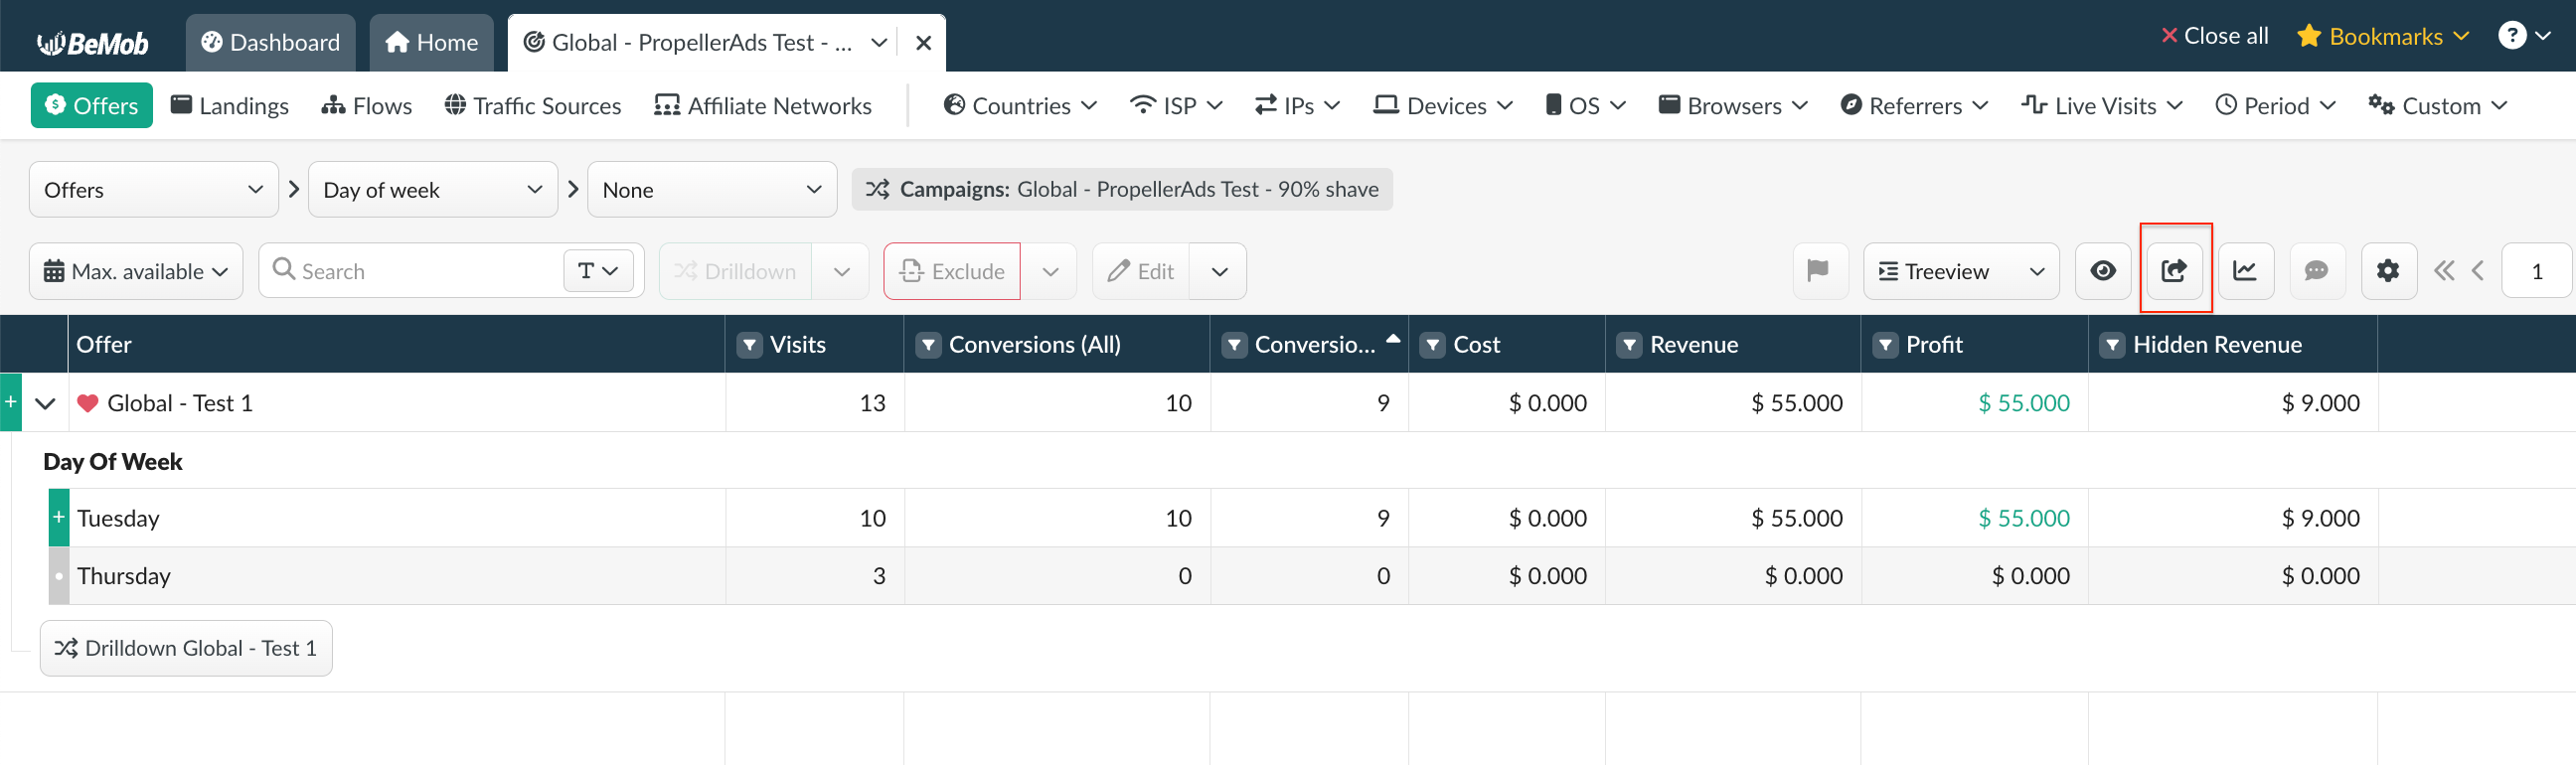
4. If you wish to share the detailed report on the campaign or other data line, access the required report and then click on Share Report icon.
The report will be shared in the tableview format.
5. After the Create Shared Report window appears you’ll need to configure it according to how you want to share the report.
Let’s go through the steps to do this:
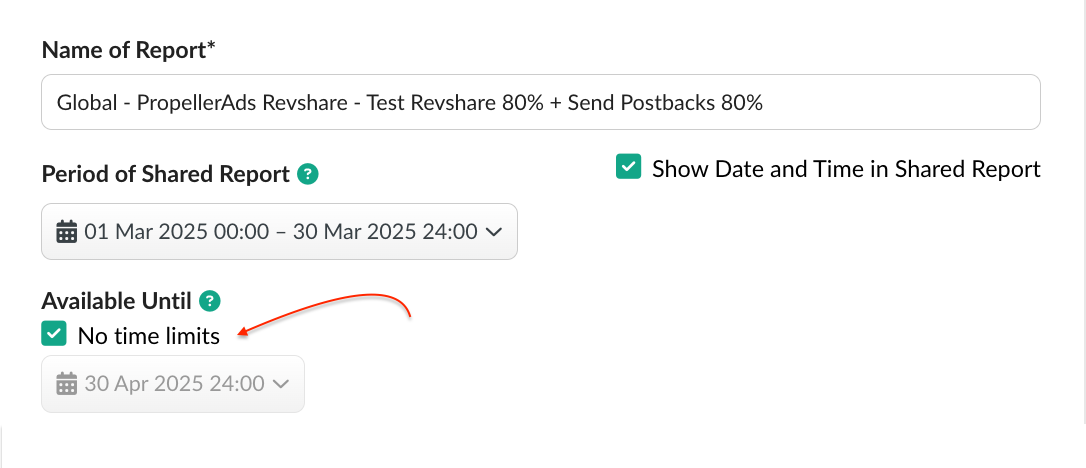
• Name of Report.
The field is obligatory. Enter a name that will appear both in the shared reports list under Multi-User Access → Shared Reports and within the shared report.
If you share a report on one element (campaign, offer etc), the name will be pre-populated with its name. In other cases you will need to specify the custom name.
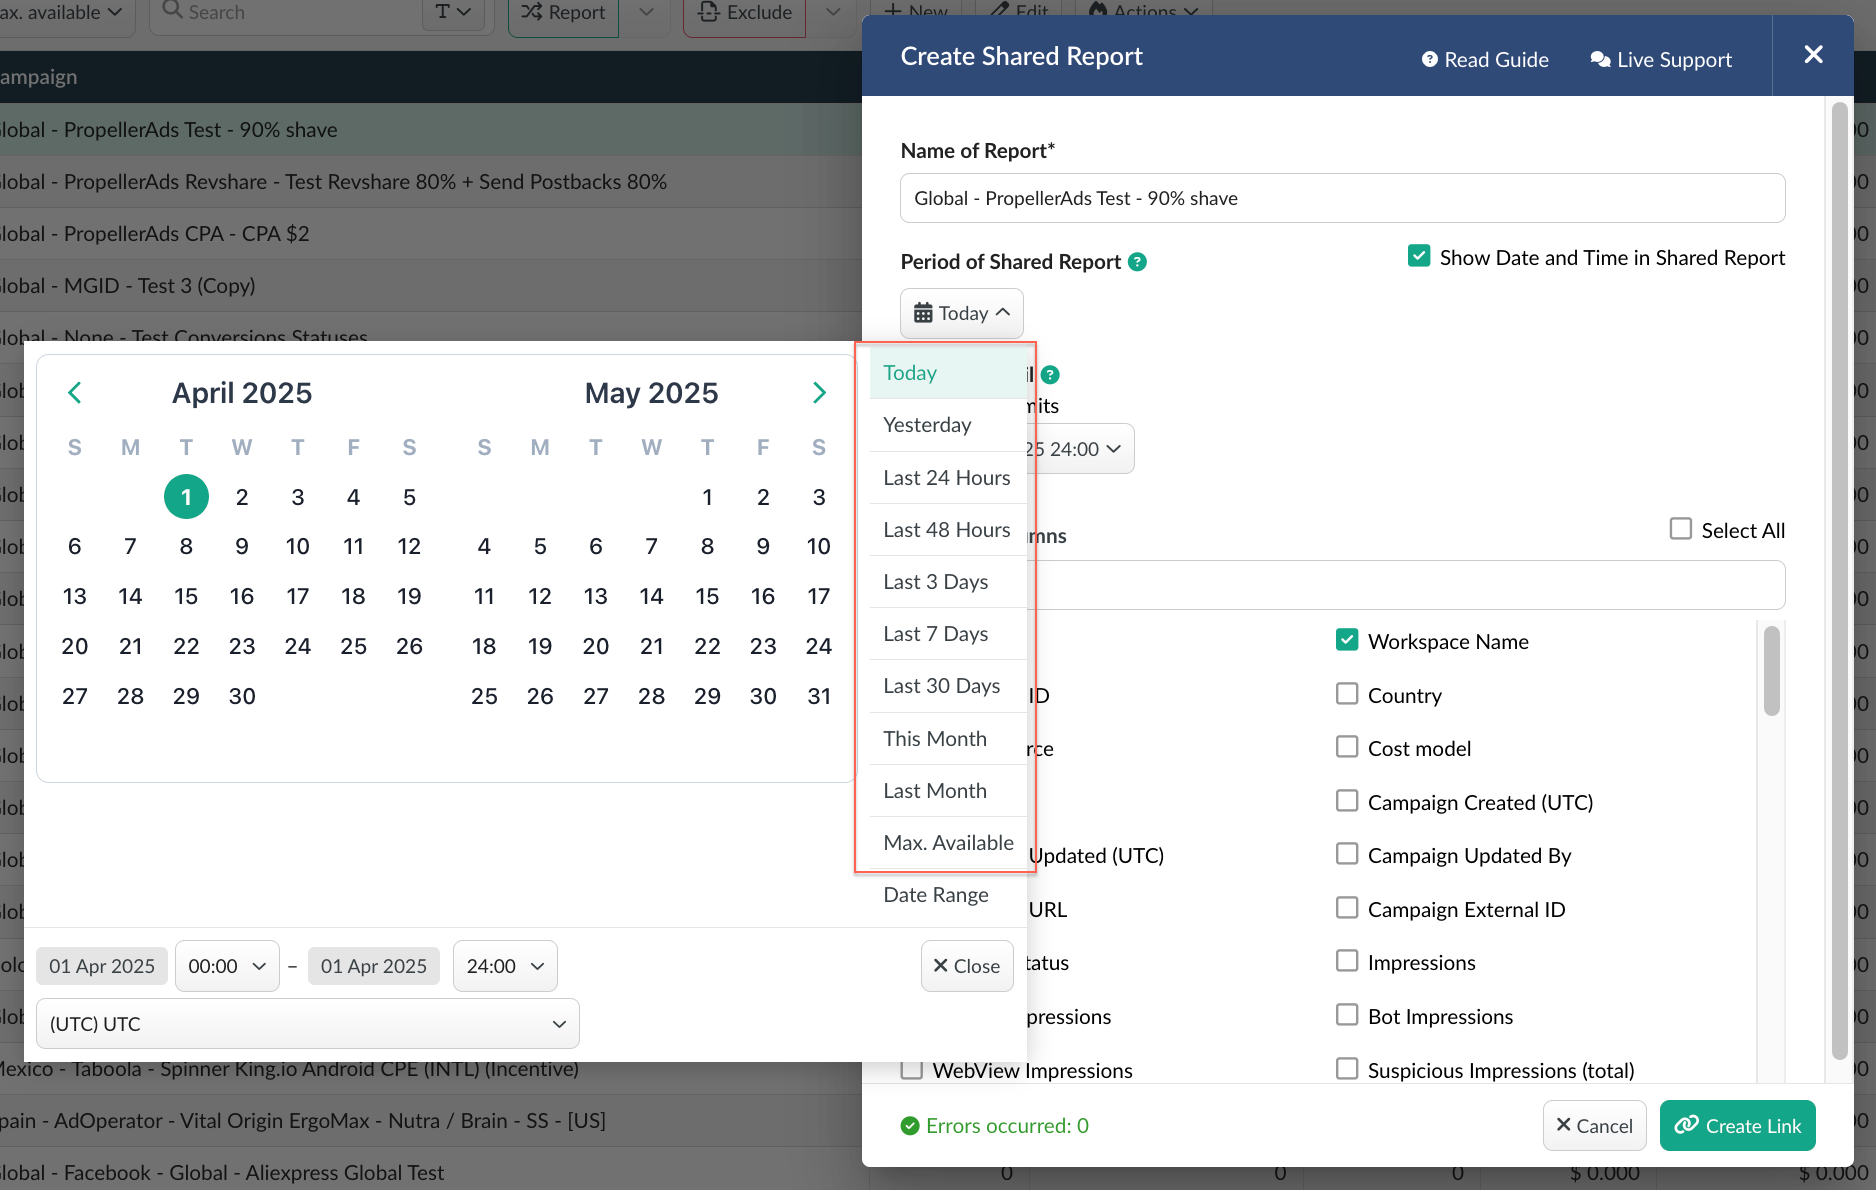
• Period of Shared Report.
Select the date and time for which the report will be shared. By default this period matches the date and time frames of the main report settings selected before the shared report settings are accessed.
As mentioned before shared reports can be created for dynamic and fixed date ranges.
If dynamic report is created, the data in this type of report updates dynamically based on the selected time range.
Example
• On March 19, you create a report for Yesterday, displaying data from March 18.
• When you access the report on March 20, it will now reflect data from March 19.
This pattern continues, ensuring the report always shows the most recent data for the chosen time frame.
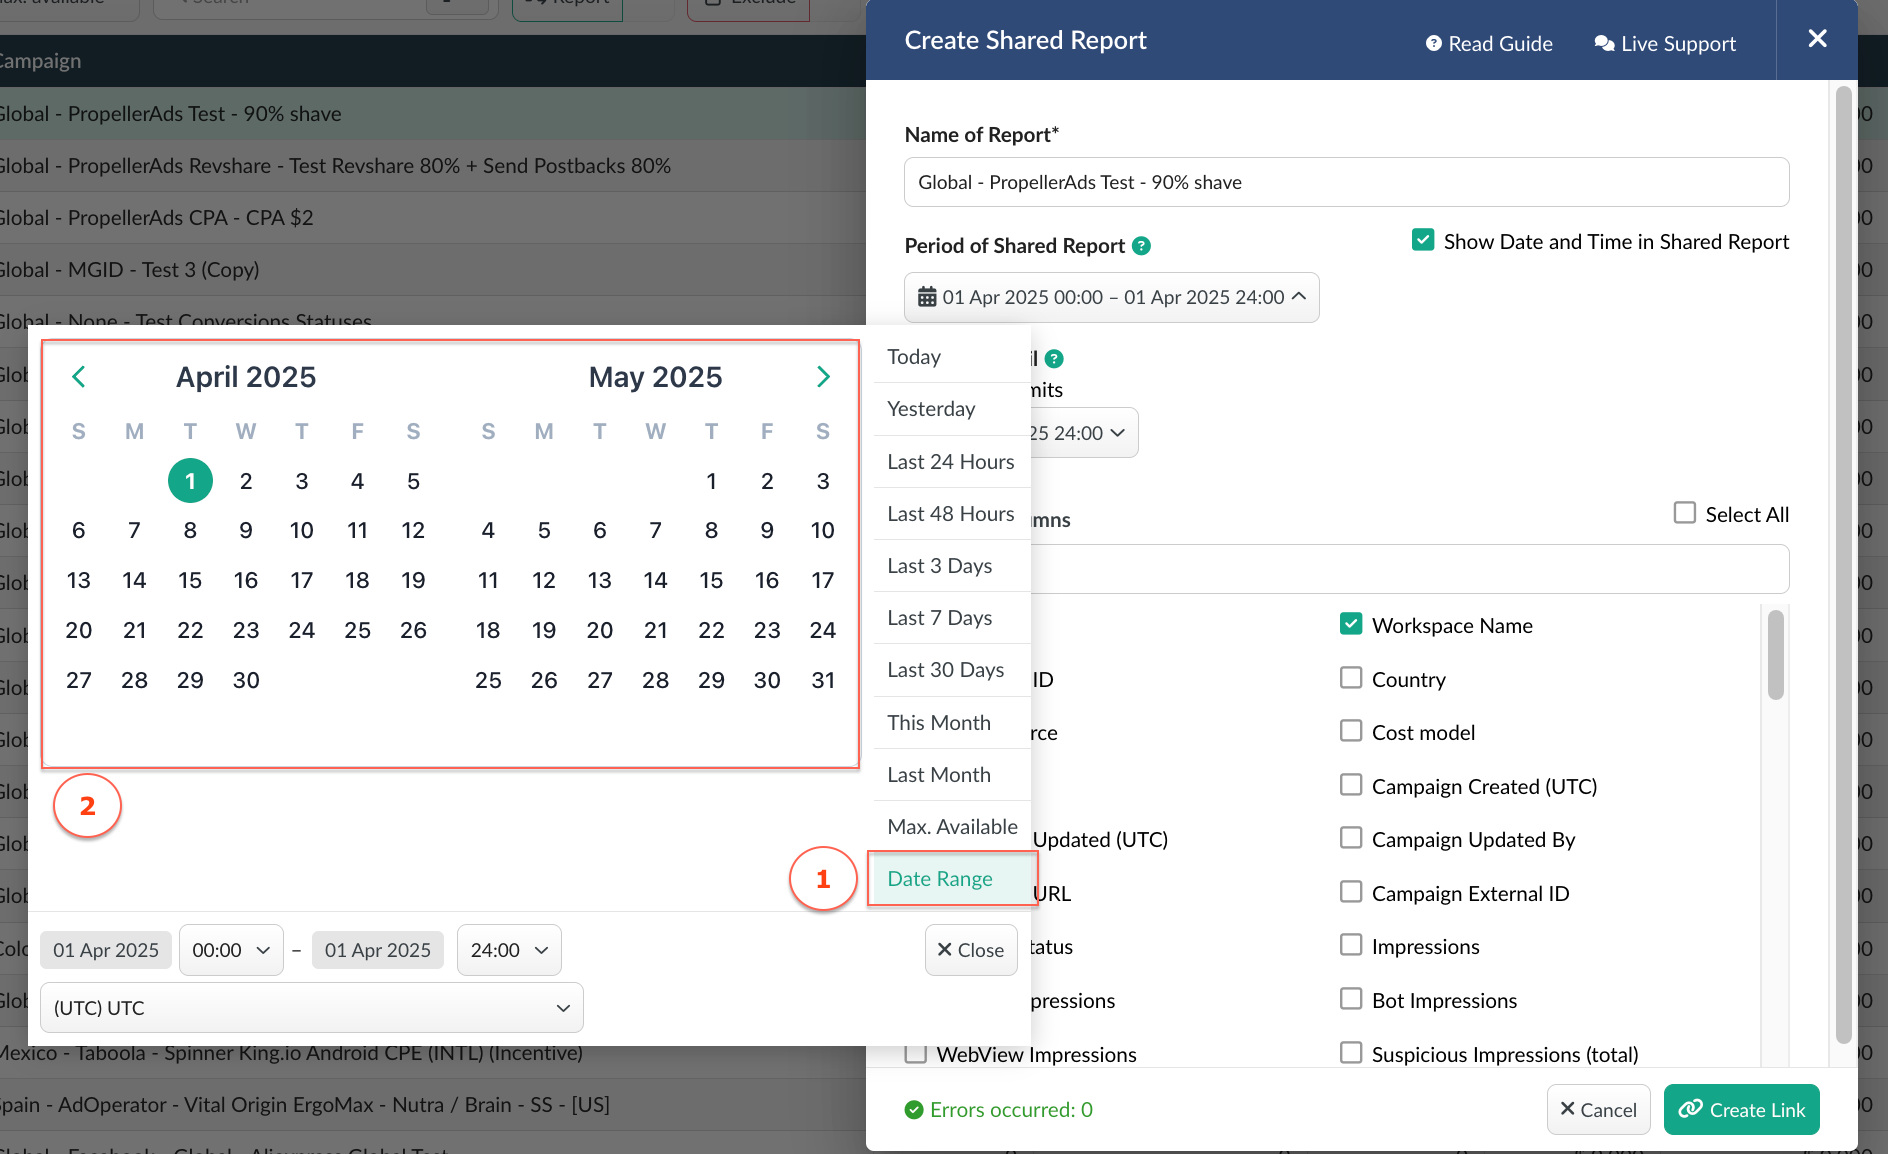
For the fixed date ranges you will be able to manually select a specific period. In this case the data in the report will not change over time.
• Show Date And Time in Shared Report.
If the checkbox is marked, the date and time of report will be visible to the third-parties with whom you're sharing the report.
In case you prefer not to share the date and time of report, you can unmark the checkbox.
• Available Until
This setting determines how long the report will be accessible via the shared link.
Select the required expiration date and time using the calendar.
To set no limits on report accessibility select No Time Limits.
• Show Columns
Select the columns with the data which you wish to include in the report for sharing with the third parties. Use the search bar to find the required column.
• Create Link
Click on the button to generate the report.
After the button is clicked Shared Report Link window will appear. Copy the link to share it immediately.
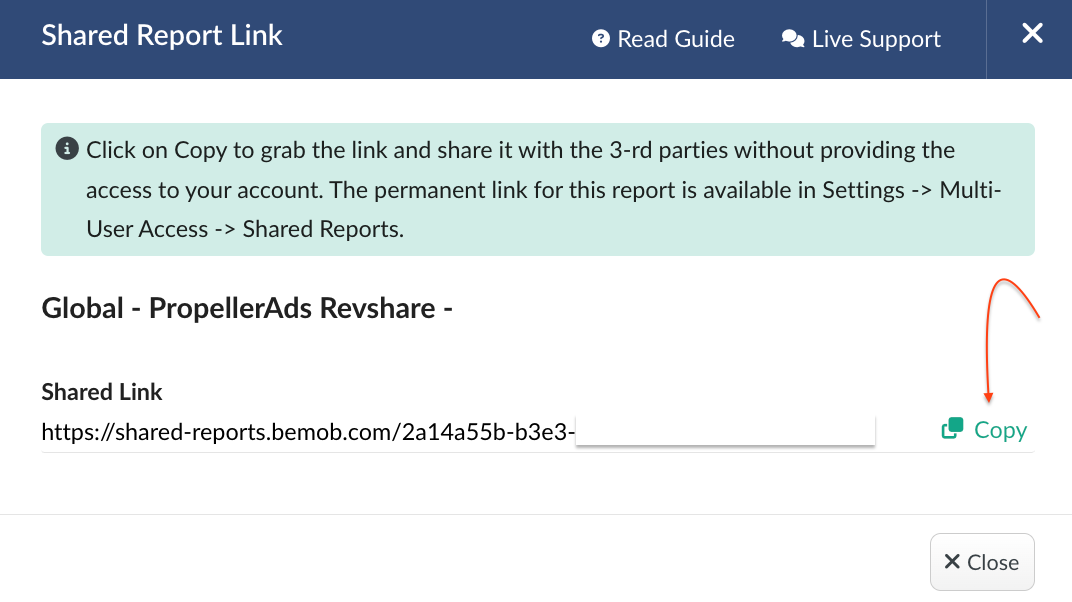
Once you provide the third party with the link they will receive the read-only access to your pre-configured report.
All the links to shared reports are stored under Multi-User Access → Shared Reports.
💡 Once you create the report we recommend to access it through the link before you share it with the associates.
Make sure you have included all the required columns, set up the correct time range and availability period.
¶ Manage Shared Report
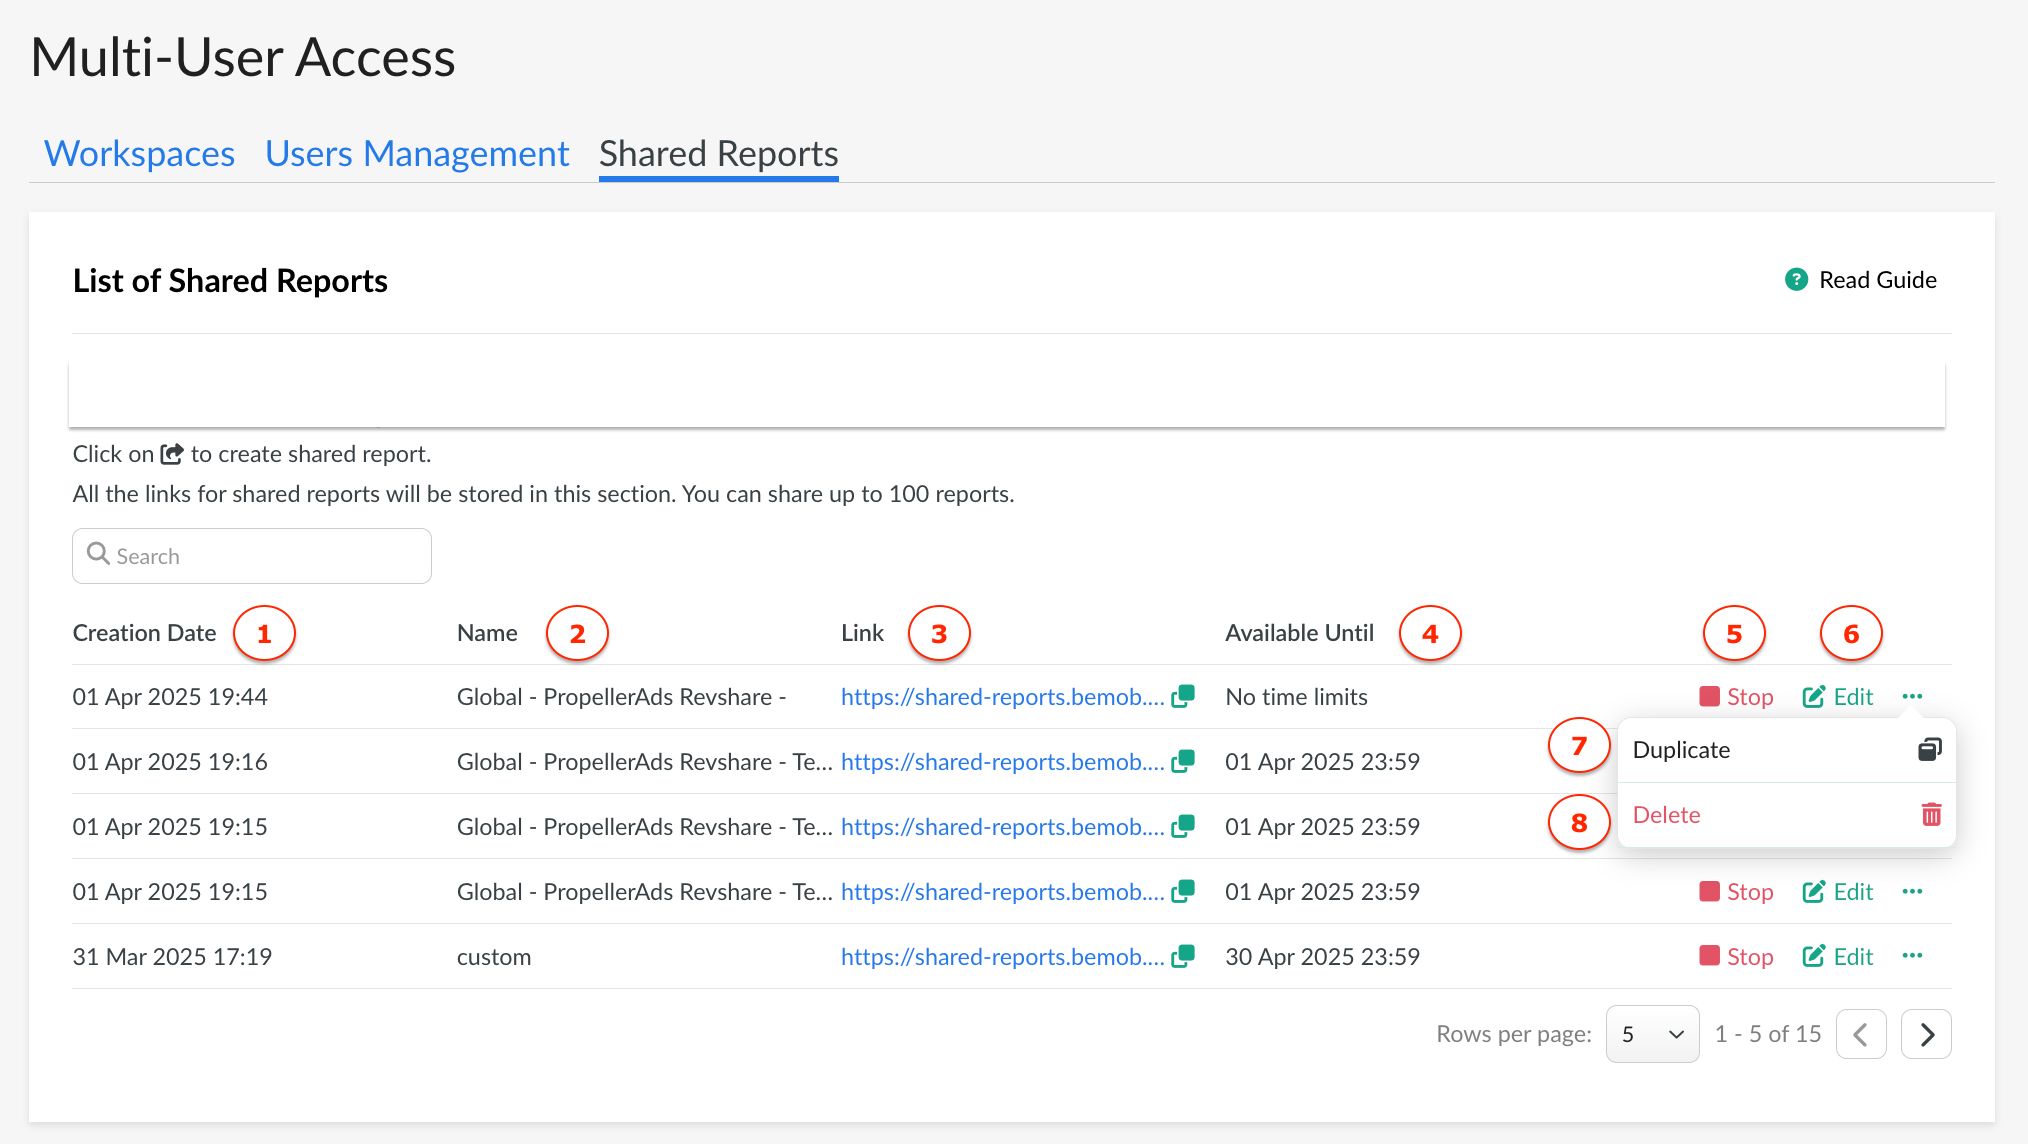
To access the list of shared reports go to Settings → Multi-User Access → Shared Reports.
All shared reports are displayed in a table with the following details:
1. Creation Date – The exact date and time the report was created.
2. Name – The unique name assigned during setup.
3. Link – A shareable link to the report.
4. Available Until – The expiration date and time of the shared link, or “No limit” if unrestricted.
5. Stop – Ends sharing before the expiration date. Once stopped, the report can be resumed later as the link remains available in your account.
6. Edit – Allows modifications while retaining the original creation date.
7. Duplicate – Creates a copy of the report.
8. Delete – Removes the report and link, making it inaccessible.
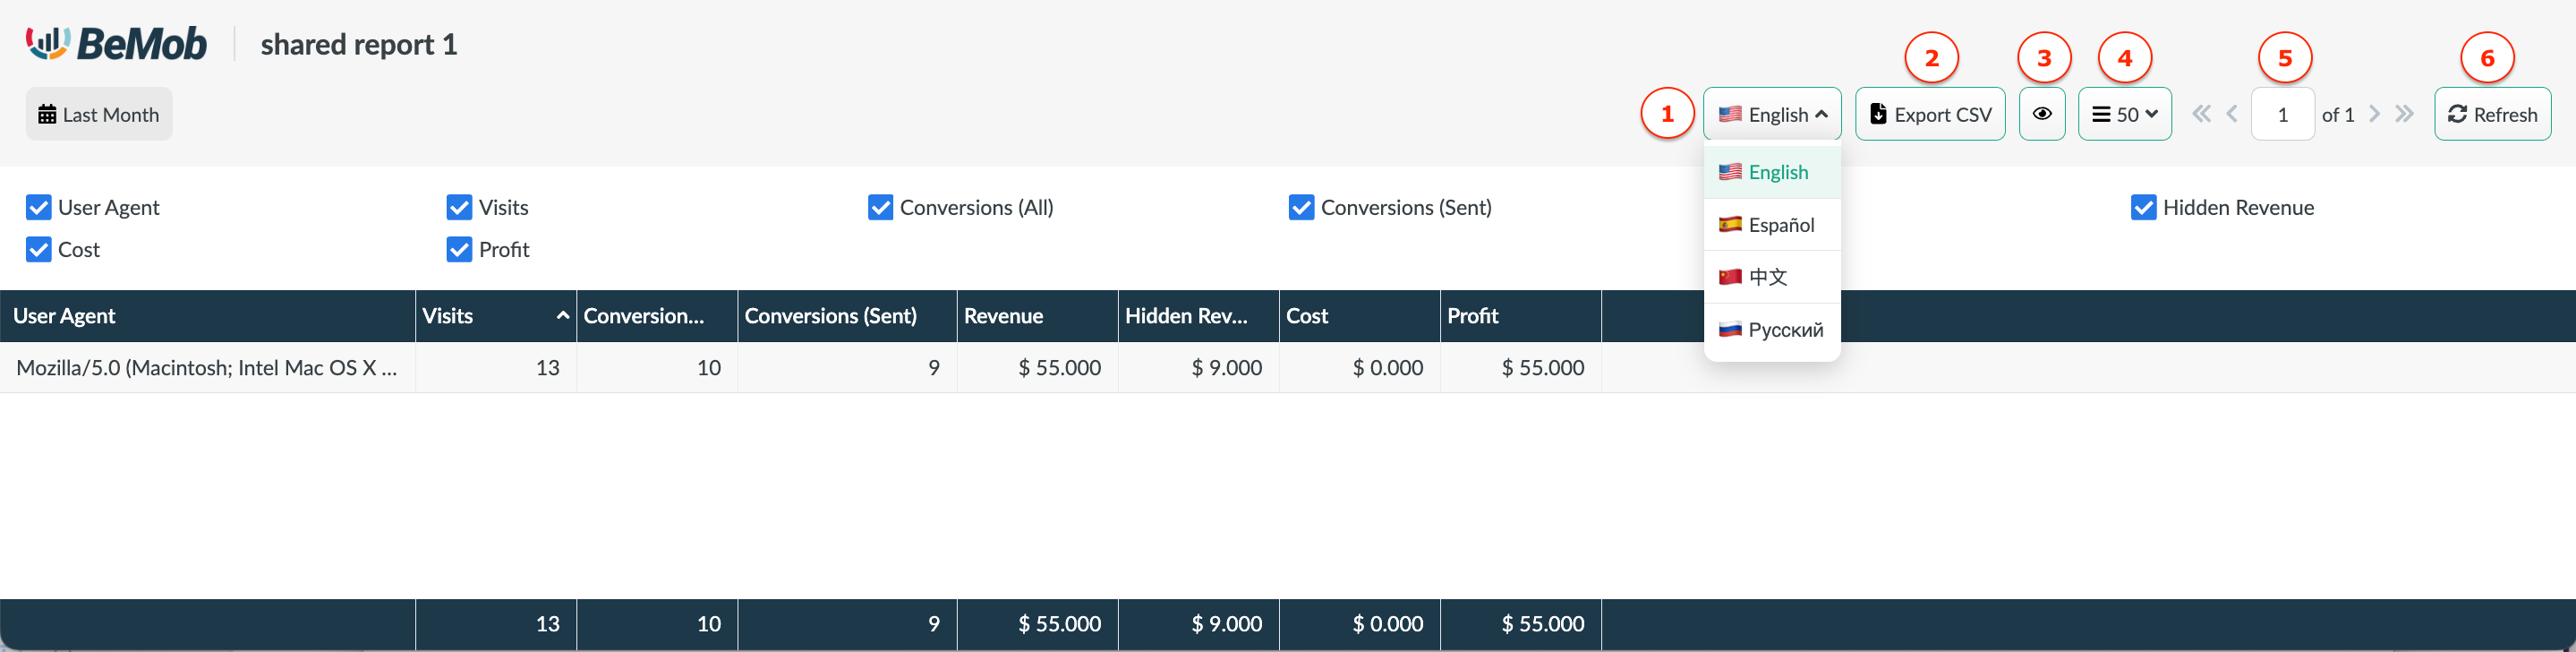
¶ Analyze Shared Reports
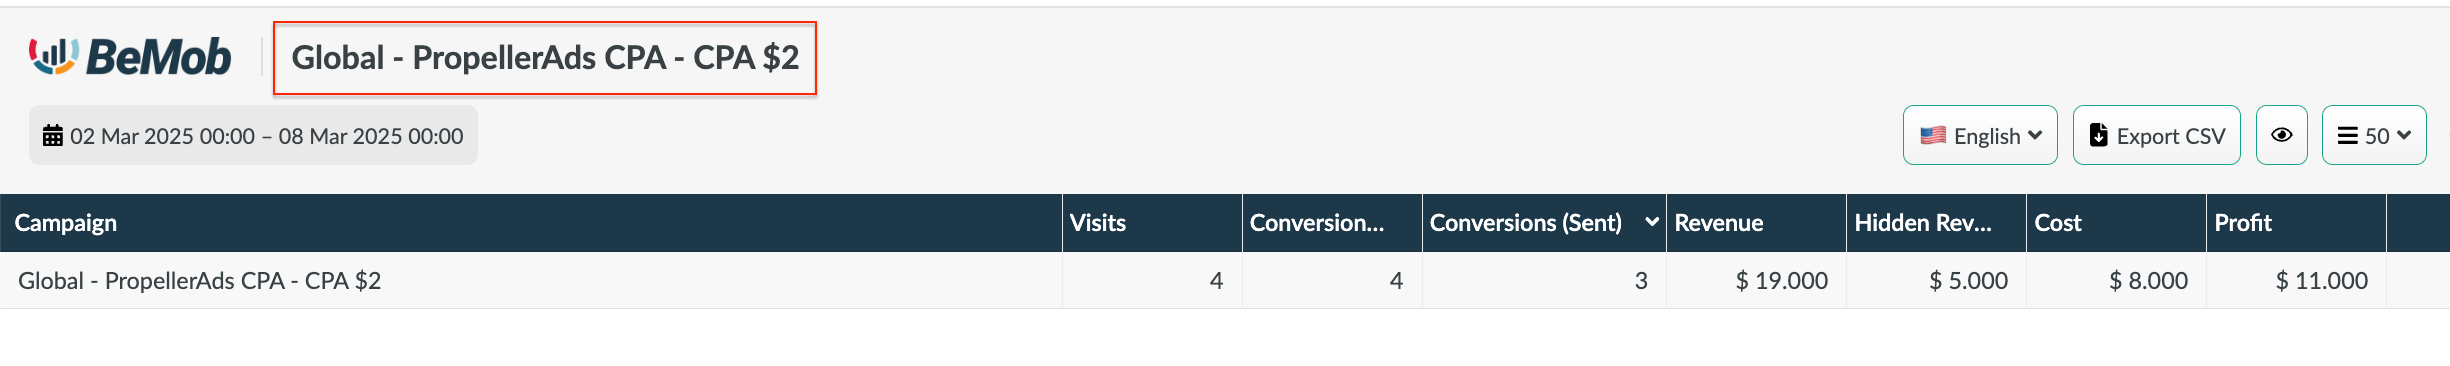
Shared reports are designed in the style of BeMob panel. The data is displayed in the table with columns which have been initially selected by the report owner.
Available Options in the Shared Report:
1. Language Settings – Users can choose from four available languages: Chinese, English, Russian, or Spanish.
2. Export CSV – The report can be downloaded in CSV format.
3. Column Settings – Extra columns can be hidden by clicking the 👁🗨 icon.
4. Row Display Settings – Adjust the number of rows shown per page, similar to the BeMob panel.
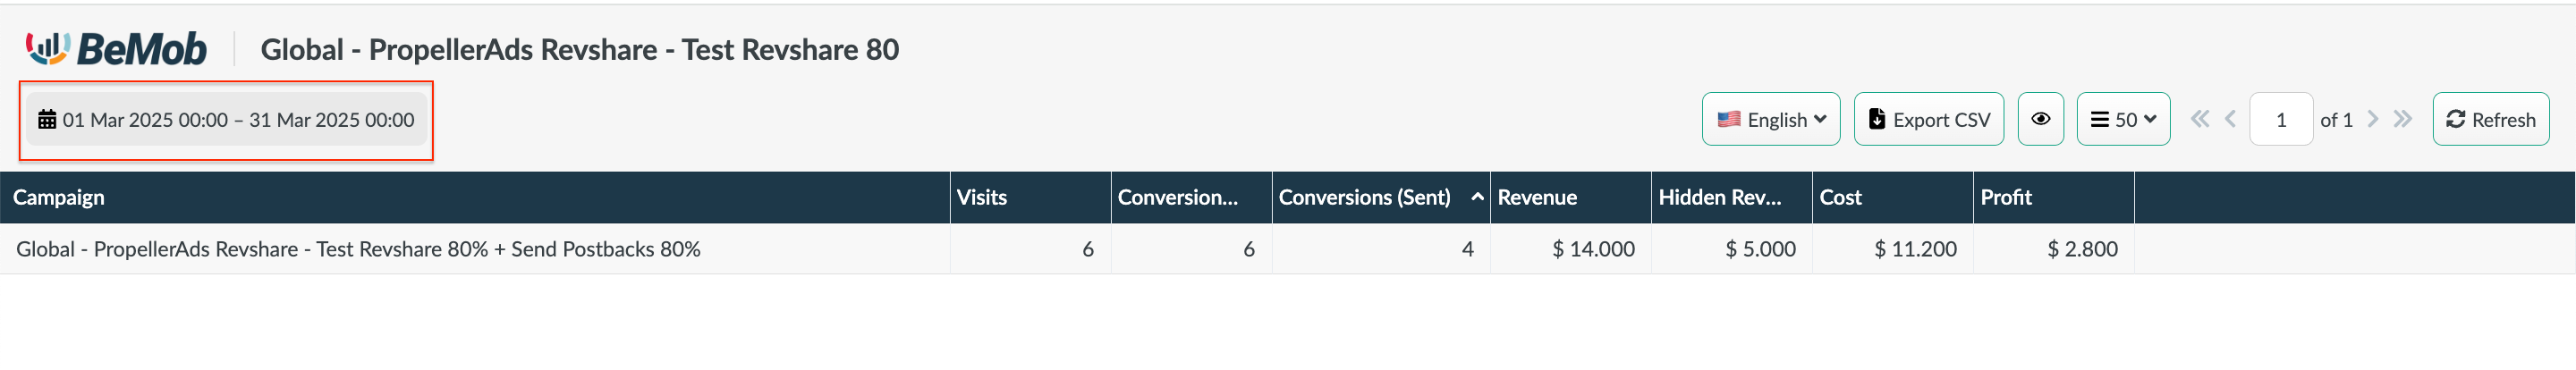
5. Pagination – Navigate through pages in the shared report.
6. Stats Refresh – Reports display dynamic, real-time data.
✍️ If you have any questions or need help with the settings contact our support team via live chat or at support@bemob.com